
最終更新日:2025年11月29日
IELTSライティングTask 1対策

このページでは、IELTS Writing Task 1で7.0以上を狙うために必要な評価基準・構成・パラフレイズの考え方を、日本人学習者向けに整理しています。
Contents
- IELTSライティング Task 1攻略ガイド|高得点を取るための書き方とコツ
- IELTSライティング時間配分とTask 1準備のコツ|高得点を取る戦略
- IELTSライティングTask 1の字数制限と注意点
- IELTSライティングTask 1の出題形式|10種類のパターン
- IELTS公式問題集に掲載されているTask 1の問題タイプまとめ
- IELTSライティングTask 1の採点基準と高得点のポイント|6.0と7.0の違いを理解する
- IELTSライティングTask 1で使う時制のルール|過去・現在・未来の使い方
- IELTSライティングTask 1での未来の表現方法
IELTSライティングTask 1の書き方(Task 1のパラグラフ構成)
- IELTSライティングTask 1対策|イントロダクションとパラフレイズの書き方
- IELTSライティングTask 1対策|イントロダクションの2文目「Overall」の書き方
- IELTSライティングTask 1対策|イントロダクションのOverall文のサンプル
IELTSライティングTask 1 覚えるべき単語・表現・書き方
実践問題サンプル20:10パターンの問題タイプ各2個づつ合計20サンプル&解説

IELTSライティングTask 1対策の基礎
IELTSライティング Task 1攻略ガイド|高得点を取るための書き方とコツ
IELTSライティングのTask 1では、グラフ・表・地図・プロセスのいずれかが出題されます。テーマは異なりますが、実は書き方にはパターンがあります。このパターンを理解し、適切な表現方法を身につけることで、Task 1はIELTSの中でも最も効率的にスコアアップできるパートです。
Task 1で高得点を狙うポイント
- 表現方法をマスターする
「このグラフにはこの表現」というルールを覚えれば、20分でも焦らずに書けます。 - パラフレイズ力を鍛える
例えば「increase」を何度も使うと、文法的に正しくてもスコアは伸びません。多様な言い換えを習得しましょう。 - 比較を意識する
グラフや表には複数の要素があり、地図問題では過去と現在、現在と未来を比較することが求められます。比較表現を使いこなすことが重要です。グラフや表に複数の要素があり、地図も2枚(過去と現在、現在と未来など)出題されるのは、比較をさせることが目的です。
ご参考Youtube
学習の第一歩:Task 1の全体像をつかむ
このページでは、Task 1の攻略法をすべて解説しています。学習を始める前に、以下のYouTube動画をご覧ください。動画で概要を理解し、その後このページで詳細を確認することで、効率的にスコアアップを目指せます。👇👇👇
IELTSライティング時間配分とTask 1準備のコツ|高得点を取る戦略
IELTSライティングはTask 1とTask 2を合わせて60分で解答します。どちらから始めても構いませんが、おすすめはTask 2からスタートです。
なぜTask 2から始めるべき?
- 採点比率が高い
Task 1は全体の1/3、Task 2は2/3の比率で採点されます。Task 2のクオリティを高めることがスコアアップの鍵です。 - 時間配分の目安
- Task 2:40分(理想は38分)
- Task 1:残り20分
Task 2に余裕を持たせることで、論理的で質の高いエッセイが書けます。
ただし、Task 1のスコアが低いと6.5以上は難しいため、Task 1もしっかり対策することが重要です。
Task 1の時間配分と準備の重要性|5分の計画がスコアを左右する
IELTSライティングTask 1は20分で解答しますが、最初の5分間の準備が成功の鍵です。
- 時間配分の目安
- 準備(計画):5分
- 執筆:15分(+余裕があれば見直し)
この「5分の計画時間」で、何をどう書くかを整理することがTask 1の出来を決定づけます。焦ってすぐ書き始めるのではなく、しっかり構成を練ることで、論理的で高得点につながる答案が書けます。
5分間で次のSTEP1~STEP4をします。
よくありがちなのが問題文を軽く読んで、グラフ・表・地図・プロセスを細かく見ようとする人がいますが、問題文は先ずしっかりと読むことがグラフ・表・地図・プロセスをしっかり理解する第1歩です。
問題文は導入文でパラフレイズすることになるので、下線/マーキングをしながらしっかりと読みましょう。
IELTSライティングTask 1の字数制限と注意点
IELTSライティングTask 1では、最低150語が必須です。目安としては180~230語程度が理想。特徴をしっかり捉えれば最大字数制限はありませんが、200語前後を目指すとバランスが良いでしょう。
字数不足に注意
- 文字間隔が広い場合、見た目では十分に書いていても、実際には150語に達していないことがあります。
- Paper-basedテストの場合、本番用紙で自分が1行に何語書けるかを事前に確認しておくことが重要です。
パラグラフごとの文字数
各パラグラフの文字数についてはパラグラフ構成と各パラグラフの文字数をご覧ください。
IELTSライティングTask 1の出題形式|10種類のパターン
IELTSライティングTask 1では、以下の10パターンの出題形式があります。それぞれのパターンで覚えるべき単語や使える表現・書き方をマスターして効率よく書けるようにしましょう。
- ダイナック棒グラフ
- ダイナミック折れ線グラフ
- ダイナミック円グラフ
- ダイナミック表
- スタティック棒グラフ
- スタティック円グラフ
- スタティック表
- 地図
- プロセス
- グラフ/表コンビネーション
グラフ・表・地図・プロセスの種類(10パターン)
棒グラフ (Bar chart)
ダイナミック or スタティック
折れ線グラフ (Line chart)
ダイナミック(スタティックはない)
円グラフ (Pie chart)
ダイナミック or スタティック

表 (Table)
ダイナミック or スタティック

地図 (Map)
e.g., 街の昔と今 (or 将来), 火山噴火前と後の変化

プロセス (Process)
e.g., アルミ缶のリサイクル工程
IELTSライティングTask 1では、グラフと表の出題率が最も高い傾向があります。一方、プロセス図は比較要素がないため出題確率は低めです。対策はグラフと表を優先してください。
なぜグラフ・表を優先するべき?
- 出題頻度が高い:棒グラフ・折れ線グラフ・円グラフ・表はほぼ毎回登場
- 表現の使い回しが可能:一度覚えた表現は複数の形式で応用できる
- スコアアップに直結:比較・変化を示す語彙をマスターすれば高得点が狙える
ダイナミック vs スタティック
- ダイナミック&スタティック共通
- どのグラフ・表でも共通して使える単語:共通して使える単語
ダイナミック(Dynamic)グラフ・表
時間経過を含むグラフや表:変化を表す表現と比較表現を中心に使います。
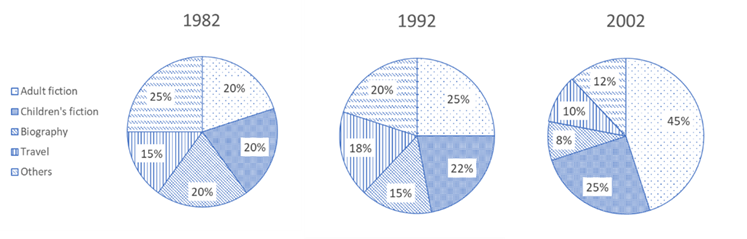
E.g.) 1982年から2002年までのある市立図書館でのジャンル別の本の貸出割合
スタティック(Static)グラフ・表
あるひと時の状態を比較するグラフや表:状態を表す表現と比較表現を使います。
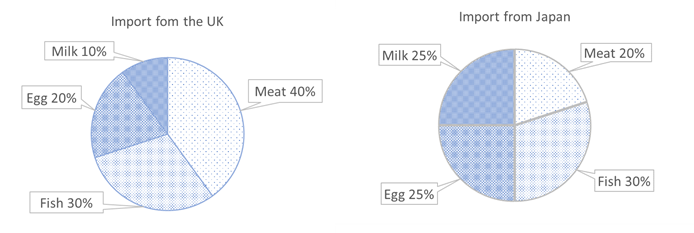
E.g.) ある国の”ある年”のUKと日本からの種類別の食料品輸入割合
IELTS公式問題集に掲載されているTask 1の問題タイプまとめ
これまでに発売されたIELTS公式問題集(Cambridge IELTSシリーズ)に掲載されているWriting Task 1の出題形式を一覧にまとめました。
問題タイプを事前に把握することで、効率的な学習計画が立てられます。購入の際の参考にしてください。
公式問題集Writing Task 1問題タイプリスト (D:ダイナミック、S:スタティック)
| 公式問題集 | D 棒グラフ | D 折れ線グラフ | D 円グラフ | D 表 | S 棒グラフ | S 円グラフ | S 表 | コンビ | 地図 | プロセス |
| 20 | Test 1 | Test 3(S表 & D棒) | Test 2 | Test 4 | ||||||
| 19 | Test 1 | Test 4 (S円 & S棒) | Test 2 | Test 3 | ||||||
| 18 | Test 2 | Test 1 Test 4 | Test 3 | |||||||
| 17 | Test 3 | Test 4 | Test 2 (D表 & D円) | Test 1 | ||||||
| 16 | Test 1 | Test 3 | Test 2 Test 4 | |||||||
| 15 | Test 2 | Test 1 | Test 4 (S円 & S表) | Test 3 | ||||||
| 14 | Test 1 | Test 2 (D棒 & S表) | Test 4 | Test 3 | ||||||
| 13 | Test 2 | Test 3 | Test 1 Test 4 | |||||||
| 12 | Test 3 | Test 1 | Test 2 | Test 4 | ||||||
| 11 | Test 3 | Test 2 | Test 1 | Test 4 (D表 & D円) | ||||||
| 10 | Test 2 | Test 3 | Test 1 | Test 4 | ||||||
| 9 | Test 2 | Test 4 | Test 3 | Test 1 | ||||||
| 8 | Test 4 | Test 2 | Test 1 (S円 & S表) | Test 3 | ||||||
| 7 | Test 3 | Test 2 | Test 4 | Test 1 | ||||||
| 6 | Test 4 | Test 2 | Test 1 (D折れ線 & S表) | Test 3 | ||||||
| 5 | Test 1 | Test 2 | Test 4 | Test 3 | ||||||
| 4 | Test 3 | Test 1 | Test 2 (D折れ線 & S円) Test 4 (D折れ線 & S棒) | |||||||
| 3 | Test 3 | Test 4 | Test 2 | Test 1 (D棒 & D折れ線) | ||||||
| 2 | Test 4 | Test 1 Test 3 | Test 2 | |||||||
| 1 | Test 1 (S棒 & S円) Test 3 (S棒 & D折れ線) | Test 4 | Test 2 |
IELTSライティングTask 1の採点基準と高得点のポイント|6.0と7.0の違いを理解する
IELTS Writing Task 1は、次の4つの採点項目で評価されます。
IELTSが公式に発表しているバンドスコア表はこちら👇
高得点を取るために押さえるべき4つのポイント
6.0と7.0の差は、以下の要素をどれだけ正確に実践できるかで決まります。
特徴を捉えた概要を書く
→ インストラクションパラグラフにOverall(全体像)を必ず含める
文と文をつなぐ接続語の適切な使用
→ 論理的な流れを作る
パラフレイズ力を高める
→ 同じ単語の繰り返しを避ける
多様な構文を使う
→ 単純な文だけでなく、複雑な文構造を取り入れる
IELTSライティングTask 1対策|採点項目1:Task achievement
6.0
- addresses the requirements of the task
- presents an overview with information appropriately selected
- presents and adequately highlights key features/ bullet points but details may be irrelevant, inappropriate or inaccurate
7.0
- covers the requirements of the task
- presents a clear overview of main trends, differences or stages
- clearly presents and highlights key features/bullet points and/or word formation but could be more fully extended
IELTSライティングTask 1で7.0を獲得するためのTask Achievementの条件
IELTS Writing Task 1でBand 7.0を取るためには、採点項目のひとつであるTask Achievementにおいて、次の3つのポイントをクリアする必要があります。
1.与えられたタスクの要件を満たす(covers the requirements of the task)
- 問題文の指示に従い、グラフ・表・地図・プロセスが何を表しているのかを特徴と比較を含めて記述すること。
IELTS Task 1の典型的な指示文は
“Summarise the information by selecting and reporting the main features and make comparisons where relevant.”
つまり、目立つ特徴をしっかり書くことが重要で、細かい部分をすべて書く必要はありません。
- グラフや表の場合、数値を適切に引用することも必須です。
2. 明確な概要を提示する(presents a clear overview of main trends, differences or stages)
- 主なトレンド(傾向)や重要な違いの概要をはっきり示すこと。
- Overallという形で全体像をIntroductionで簡潔にまとめるのがポイント。
3. 重要な特徴を明確に示す(clearly presents and highlights key features/bullet points and/or word formation but could be more fully extended)
- グラフ・表・地図・プロセスの特徴をわかりやすく説明すること。
IELTSライティングTask 1対策|採点項目2:Coherence and cohesion
6.0
- arranges information and ideas coherently and there is a clear overall progression
- uses cohesive devices effectively, but cohesion within and/or between sentences may be faulty or mechanical
- may not always use referencing clearly or appropriately
7.0
- logically organises information and ideas; there is clear progression throughout
- uses a range of cohesive devices appropriately although there may be some under-/over-use
IELTSライティングTask 1で7.0を獲得するためのCoherence and Cohesionの条件
IELTS Writing Task 1でBand 7.0を取るためには、Coherence and Cohesion(一貫性と結束性)において次の2つのポイントをクリアする必要があります。
1. 論理的な構成(logically organises information and ideas; there is clear progression throughout)
- 情報やアイデアが論理的に整理され、全体に明確な流れがあること。
- 読むだけで、グラフ・表・地図・プロセスの内容がイメージできる文章構成を目指します。
2. 適切な結束表現の使用(uses a range of cohesive devices appropriately although there may be some under-/over-use)
- いろいろな接続詞、文と文をつなぐ語句が適切に使われていること。
- Signposting words (文頭で前後の関係を示す語句)を適切に使うこと。何を比較しているのか、どのような特徴を言いたいのかを明確にさせること。
Signposting wordsの使い方
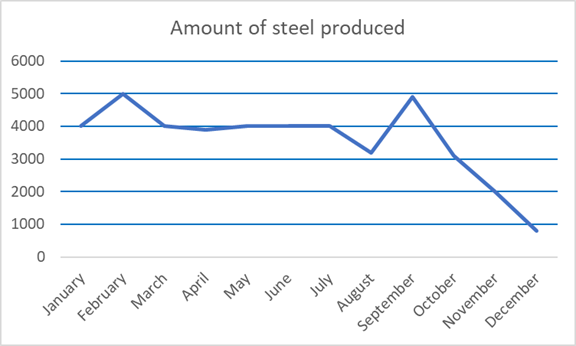
Steelの製造量:
1月:4000 tonから始まり
2月:1000 ton増加(5000 ton)
3月:4000 tonに戻る
3月から7月:4000 tonを保つ
8月:3000 tonちょっとまで下がる
9月:5000 tonにまで増加
9月から12月:1000 tonにまでだんだんと下がる
* tonnes: British English, tons: American English
Signposting wordがない文 = 単調にいつどうなったかが書かれているだけの文
The amount of steel manufactured started from 4000 tonnes in January. It increased by 1000 tonnes in February and reverted back to 4000 tonnes in March. The amount levelled off between March and July at the 4000 mark. In August, this figure dropped to just above 3000 tonnes. It surged to nearly 5000 tonnes in September. From September to December, it continuously declined to just under 1000 tonnes in December.
スチールの製造量は1月の4000トンから始まった。2月には1000トン増加し、3月には4000トンに戻った。3月から7月にかけては4000トンで横ばいだった。8月には3000トン強に減少した。9月には5000トン近くまで急増した。9月から12月にかけては減少が続き、12月には1000トン弱となった。
Signposting wordがる文(+ 時間の経過の表現を変更) = 読み進めながらグラフを想像しやすい文
The line graph illustrates the amount of steel manufactured every month during a year with starting from 4000 tonnes in January. After that, the figure increased by 1000 tonnes in the next month before reverting back to 4000 tonnes in March. Subsequently, the amount levelled off at the 4000 mark until July. Furthermore, in the following month, there was a drop to just above 3000 tonnes. Although it surged to nearly 5000 tonnes in September, the quantity continuously declined from October to December to just under 1000 tonnes, which is less than a quarter of the figure in January.
折れ線グラフは、1月の4000トンから始まった年間の毎月のスチール生産量を示している。 その後、翌月には1000トン増加したが、3月には4000トンに戻った。 その後、7月までは4000トン台で推移した。 さらに、翌月には3000トン強まで減少した。 9月には5000トン近くまで急増したが、10月から12月にかけては1000トン弱にまで減少を続け、(12月には)1月の4分の1以下となった。
絶対覚えておくべきSignposting words
—について述べる(about—よりフォーマル)
With respect to …/ In terms of … / With regards to …/ As for …/ Concerning…
情報を追加する
Furthermore, … / Moreover, …
同じようなポイントを述べる
Similarly, … / Likewise, … / Also, …
比較する
By contrast, … / Unlike …/ Conversely, …
—ではあるけれども/—だとしても
Although … / Even though … / However, …/ Nevertheless, …/Despite, …
結果を述べる
Therefore, … / Subsequently, … / As a result (of), …/ As a consequence (of), …
続いての状態を述べる
After that, … / …, after then …
複数のグラフ・表が問題に与えられたときは、ボディ1:”According to—” / ボディ2:”Turning to —-“のSignposting wordsでスタートさせて、それぞれのパラグラフがどのグラフについて書かれているかを明確にする。
ボディ1:According to the pie chart, water consumption in residences, namely apartments and houses, made up a 70% share of the total, with apartments and houses standing at 57% and 13%, respectively.
—-(続)その他Pie chartから言えること
ボディ2:Turning to the bar chart, the main purpose of water consumption in residences was for bathrooms and gardens at approximately 28% each, meaning that the majority of water was used for these two purposes.
—-(続)その他bar chartから言えること
IELTSライティングTask 1対策|採点項目3:Lexical resource
6.0
- uses an adequate range of vocabulary for the task
- attempts to use less common vocabulary but with some inaccuracy
- makes some errors in spelling and/or word formation, but they do not impede communication
7.0
- uses a sufficient range of vocabulary to allow some flexibility and precision
- uses less common lexical items with some awareness of style and collocation
- may produce occasional errors in word choice, spelling and/or word formation
IELTSライティングTask 1で7.0を獲得するためのLexical Resourceの条件
IELTS Writing Task 1でBand 7.0を取るためには、Lexical Resource(語彙力)において次の3つのポイントをクリアする必要があります。
1. 語彙の幅と柔軟性(uses a sufficient range of vocabulary to allow some flexibility and precision)
- 同じ単語の繰り返しは絶対に避ける
- 常にパラフレイズを心掛ける
- 特に連続する2文で同じ単語を使わないことが重要
パラフレイズのない文
The number of burglaries started in first place out of the three kinds of crimes, standing at just below 3500 in 2003, before slightly increasing to nearly 3800 in 2004. After that, the number of burglaries continuously decreased to approximately 1200 in 2008. Subsequently, after it showed an increasing trend to just below 1500 in 2009, the figure levelled off at 1500 until 2012.
空き巣の発生件数は3つの犯罪の中で最も多く、2003年に3500件弱で始まり、2004年には3800件近くまで微増した。その後、空き巣の発生件数は減少を続け、2008年には約1200件となった。その後、2009年に1500件弱まで増加傾向を示した後、2012年までは1500件で横ばいとなった。
パラフレイズのある文
The number of burglaries started in first place out of the three kinds of crimes, standing at just below 3500 in 2003, before slightly increasing to nearly 3800 in 2004. After that, the figure continuously dropped to approximately 1200 in 2008. Subsequently, after it showed an upward trend to just below 1500 in the next year, the figure plateaued at the same level until the end of the period.
空き巣の発生件数は3つの犯罪の中で最も多く、2003年に3500件弱で始まり、2004年には3800件近くまで微増した。その後、減少が続き、2008年には約1200件となった。その後、翌年には約1500人弱まで増加傾向を示した後、同水準で推移した。
パラフレイズした箇所
number of burglaries ⇒ the figure
Increasing ⇒ upward (decreaseももう一回出てくる場合にはdropなどに変える)
2009 ⇒ the next year (すべてin 20XXと書かない)
2012 ⇒ the end of the period (すべてin 20XXと書かない)
1500 ⇒ the same level (すべての数字をダイレクトに書かない)
Task 1 イントロダクションパラグラフ(最初のパラグラフ)の問題文のパラフレイズについてはこちら。
2. コロケーションの正確な使用(uses less common lexical items with some awareness of style and collocation)
- コロケーション(単語の自然な組み合わせ)を正しく使う
- 文法的に正しくても、コロケーションが不自然だと意味が通じない
- Task 1ではグラフや表の説明のみなので、Task 2(Writing Task 2のLexical resource)ほどコロケーションに注意する必要はない。
3. 単語選択・スペル・語形成の正確さ(may produce occasional errors in word choice, spelling and/or word formation)
- 正しい単語を選ぶこと
- 書き言葉で書くこと(話し言葉やPhrasal Verbは減点対象)
- Speakingで加点される表現でも、WritingではNGになる場合があるので注意
IELTSライティングTask 1対策|採点項目4:Grammatical range and accuracy
6.0
- uses a mix of simple and complex sentence forms
- makes some errors in grammar and punctuation but they rarely reduce communication
7.0
- uses a variety of complex structures
- produces frequent error-free sentences
- has good control of grammar and punctuation but may make a few errors
IELTSライティングTask 1で7.0を獲得するためのGrammatical Range and Accuracyの条件
IELTS Writing Task 1でBand 7.0を取るためには、Grammatical Range and Accuracy(文法の幅と正確さ)において次の3つのポイントをクリアする必要があります。
1. 多様な構文を使う(uses a variety of complex structures)
- いろいろな構文をいれること:全ての構文が能動態で同じ主語の文を繰り返してしまうとスコアは伸びない
- 能動態と受動態をバランスよく使用
- There is/are構文や単文(S+V)と複文(S+V+接続詞+S+V)を組み合わせる
- 同じ主語・同じ構文の繰り返しは避ける: Grammatical rangeの広さをアピールする
主語を変えるポイント
ポイント1:Number/Figure (数)やProportion/Percentage(割合)を主語にする
The number of individuals who participated in the film clubs was just below 65 in 2000, which gradually dipped to almost 60 in 2010, before it recovered to slightly above 65 in 2020.
👉フィルムクラブ(film clubs)に参加した人の数は2000年に65人だったが、2010年に60人に下がって、2020年に65人にあがった。(it=number)
In 2007, the number of visits reached its highest level, with a modest increase of 65,000, while total expenses slightly decreased by £42 million.
👉2007年に訪問者の数は65000人上がって最高値に達したが、(訪問者の)出費は£42 million減った。
The proportion of individuals migrating to accompany others was similar, at 15% for immigrants and 13% for emigrants.
👉誰かと一緒になるために移住した人の割合はほぼ同じで、immigrantsは15%でemigrantsは13%だった。
The proportion of visitors who rated their experience as “dissatisfied” was highest in the year before the refurbishment, at 40%.
👉”dissatisfied”(がっかり)と評価した人の訪問者の割合は改修前は40%で最大だった。
ポイント2:人やものを主語にする
The second highest earning households experienced a moderate rise concluding the period at 15 million.
👉二番目に所得が高い世帯は少し増え期間の最後では15 million人だった。
A new facility containing showers and toilets has been constructed on the north side of the car park, which now connects directly to the main road.
👉シャワーとトイレを含む新しい設備がmain roadにつながっている駐車場の北側に作られた。(地図)
Kyoto’s subway is the smallest at just 11 km and serves 45 million passengers annually. Similarly, Los Angeles operates a 28 km network with 50 million annual users.
👉京都の地下鉄は全長11㎞で最も小さく年間45 millionの乗客に利用されている。同様に Los Angelesは全長28㎞、年間利用者50 millionの地下鉄を運行している。
対比(whileなど)を使って2文をつなげる場合、1文目を数を主語にして、2文目を人を主語にすれば同じ書き方の繰り返しを避けれる。
By 2015, the number of the richest households had risen sharply to around 33 million, while the two lowest-earning groups showed slightly declining trends of about one million each, ending at around 27 to 28 million.
👉最も裕福な世帯の数は33million世帯に一気に上がり、所得の少ない2つ(最貧層と二番目の貧しい層)のグループは1million程度減り27-28millionくらいになった。
ポイント3:行動を主語にする
The production of sawn wood commenced at 200 million tonnes in 1980 declined steadily to 150 million tonnes in 1990 and further dropped to just below 130 million tonnes by 2000.
👉1980年に200million tonからスタートしたsawn woodの生産は1990年に150million tonまで徐々に減り、2000年には130million ton弱までさらに減った。
Healthcare expenditure was markedly higher in the United States, at nearly 8%, whereas all other countries allocated less than 5% to medical expenses.
👉Healthcareへの支出はUnited Statesでは8%と非常に高く、一方で他の国は5%未満だった。
In Brisbane and Adelaide, visiting cafés was less popular, with 55% and about 48% of residents, respectively, engaging in this activity.
👉Brisbane and Adelaideでは、カフェに行くことはあまり人気がなく、それぞれ55%と48%の住人がそうしていた。
ポイント4:There is (was)/There are (were)構文にする
Between these two years, there was a marginal growth of 1% in the number of people volunteering in healthcare category, though the proportion remained the smallest category at 7% in 2008 and 8% in 2014.
👉これらの2年間で、healthcare categoryでボランティアをした人の数は1%増えたが、その割合は2008年では7%、2014年では8%と最小だった。
Overall, there were upward trends in most categories, with total spending showing the largest proportional growth.
👉全体的に全てのカテゴリで増加する傾向にあり、total spendingは割合的に最も大きな増加があった。
To the south and west of the docks, there was previously a marina for private yachts, along with showers, toilets, and a car park connected to the main road running north to south.
👉船着き場(Dock)の南と西側のエリアでは、プライベートヨット用のマリーナが、シャワー、トイレ、南北にはしるmain roadにつながる駐車場に沿ってあった。(地図)
思いついた文が、能動態、受動態、There is/are構文、分詞構文、付帯状況のwith、接続詞(conversely → while/whereas)に変換できないかを常に考えながら書く。
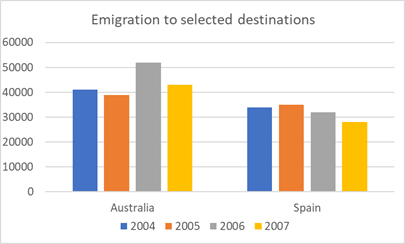
同じ主語だけの文
The number of emigrants that Australia accepted in 2004 and 2005 was around 40,000 in each year. The figure surged to just above 50,000 in 2006 and dropped to approximately 43,000 the next year. The number of emigrants entering Spain was different. The figure stood at about 35,000 in 2004 and also in 2005. The number declined to about 33,000 in 2006 and further decreased to about 28,000 in 2007.
オーストラリアが2004年と2005年に受け入れた移民の数は、いずれの年も約4万人であった。 2006年には約5万人強まで急増し、翌年には約43,000人まで減少した。 スペインへの移民の数は異なっていた。 2004年と2005年には約35,000人であった。 2006年には約33,000人まで減少し、2007年には約28,000人までさらに減少した。
主語を変えて接続詞・分詞構文を使った文
Australia accepted around 40,000 emigrants in 2004 and 2005, while the number surged to just above 50,000 in 2006 and dropped to approximately 43,000 the next year. A different trend was seen in Spain with the number standing at about 35,000 in 2004 and also in 2005, before declining to about 33,000 in 2006. In the subsequent year, there was a further decrease to about 28,000.
オーストラリアは2004年と2005年に約4万人の移民を受け入れたが、2006年には5万人強まで急増し、翌年には約43,000人まで減少した。 スペインでは傾向が異なり、2004年と2005年に約35,000件を記録したが、2006年には約33,000件まで減少した。翌年にはさらに減少し、約28,000件となった。
- 無生物主語:Australiaが主語
- 能動態:the numberが主語
- 受動態:A different trendが主語
- There is/are構文の使用
ダイナミックグラフ・表で分詞構文を使って2つの要素を比較
Although sales of clothes almost plateaued initially at around £30,000 during the first five years, they decreased gradually over the subsequent decade, making furniture the most profitable product.
衣類品の売り上げは最初の5年は約£30,000でほぼ一定だったが、次の10年でゆっくりと下がり、(それに伴い)家具が最も売上げの高い製品になった。
スタティックグラフ・表で分詞構文を使って状況を説明
Teachers work the most overtime, spending around 50 hours working overtime every month.
学校の先生が最も残業をしており、毎月50時間の残業をしている。
スタティックグラフ・表で付帯状況のwithを使って状況を説明
The tennis club was the most popular in the school, with 33% of boys and 35% of girls joining it.
テニスクラブが学校で一番人気があり、33%の男子と35%の女子が参加している。
プロセスの過程を分詞構文を使って説明
There are seven stages in the process of manufacturing the iron bars, starting with melting the metal and ending with the finished products being checked manually.
金属棒の製造には7つの製造工程があり、金属を溶かすところから始まり完成品を人がチェックして終わる。
2. エラーのない文を書く(produces frequent error-free sentences)
- スペルミスや基本的な文法ミスを防ぐ
3. 文法と句読点の正確なコントロール(has good control of grammar and punctuation but may make a few errors)
- 冠詞・前置詞・三人称のS・単数/複数の一致を徹底
- コンマやピリオドの使い方も正確に
- 小さな文法ミスは許容されるが、頻発するとスコアが下がる
IELTSライティングTask 1で使う時制のルール|過去・現在・未来の使い方
IELTS Writing Task 1では、時制の使い分けが重要な採点ポイントです。基本ルールは次の通りです。
- 過去のデータ → 過去形を使用
- 現在のデータ → 現在形を使用
- 未来の予測 → 未来形(will + 動詞)を使用
特に、グラフ・表・地図で未来の予測が示されている場合は必ず未来形や未来を表す動詞を使うこと。時制の誤りはスコアに直結するため注意しましょう。
ダイナミックグラフ・表
ダイナミックグラフ・表には、毎年の変化を表すブラフ(主に折れ線ブラフ)と一定期間ごとの変化を表すグラフがある。
”ずっと上がり続けていた(いる)”を表す場合でも進行形は使わない。進行形は一時的な要素を含むので長い期間の表現には適さない。
毎年の変化の場合
何年にどうなったかが分かるのでその年のことを過去形で表す。

「2010年にburglaryの数は3500からスタートした」、「2011年に(3500から)数百上がった」などは”began — in 2010″や”increased — in 2011″で、「(その後)2015年にかけて1000まで下がった」などは”decreased — until 2015″のように過去形で書く。
With regards to burglary, the number began at just below 3500 cases in 2010, which was the highest among the three categories, before increasing by a few hundred in 2011 and then declining continuously until 2015 to just 1000. After that, the figure rose to nearly 1500 in 2016 and levelled off until 2018, before dropping slightly to just under 1500 in 2019.
強盗については、2010年は3500件弱で3つの犯罪の中で最も多く、2011年に数百件増加した後、2015年まで減少を続け、1000件となった。その後、2016年に1500件近くまで増加し、2018年まで横ばいであったが、2019年には1500件弱まで減少した。
一定期間ごとの変化
期間内での変化を表して、何年にどうなったとは書けない場合は、過去形だけではなく過去完了形も使う。
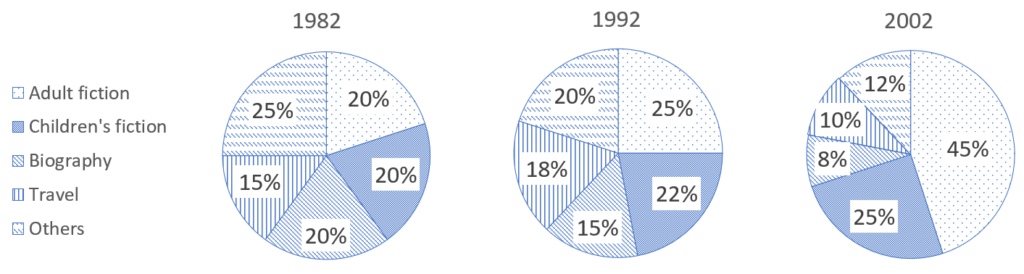
この場合、1982年から1992年にかけて10年間で20%から25%に増えた。1992年にいきなり20%から25%に増えたのではないので”increased — in 1992″とは書けない。
例えば、Adult fictionは、過去完了を使って”1992年まで(by 1992)”に(20%から)25%に増えたと表現するか、過去形で”1982年から2002年の間に(During the decade from 1982 to 2002)”(20%から)5%増えたと表現する。
過去形でincreased by 5% in 1992と書いてしまうと、1992年に5%増えたことになってしまう。ただし、1982年に20%だったというのは過去の事実なので、stood at 20% (one fifth) in 1982と過去形で書く。
The categories of adult fiction and children’s fiction underwent continuous growth. Both stood at one fifth in 1982, and the former had grown to a quarter and the latter had risen by 2% by 1992. During the two decades from 1982 to 2002, adult fiction sales more than doubled to represent 45% and children’s fiction rose by 5%, resulting in the subtotal proportion of these two genres making up a 70% share in 2002.
成人向け小説(Adult fiction)と児童小説(Children’s fiction)は増加を続けた。1982年にはどちらも1/5(20%)で、前者は1/4(25%)に、後者は1992年までに2%上昇した。 1982年から2002年までの20年間で、成人向け小説の売り上げは倍増して45%となり、児童小説は5%上昇した。その結果、2002年にはこれら2つのジャンルの小計の割合は70%となった。
スタティックグラフ・表
一時点のことを示しているので、過去の状態のことは過去形、現在の状態のことは現在形で書く。
地図
過去形、過去完了形、現在形、現在完了形、(未来形)を適切に使って現在の状態や過去の状態を表す。
過去形は過去の一時点のできごとのみを表すが、現在完了形は過去のできごとが今まで続いていることを表し、過去完了形は過去のできごとが過去の時点まで続いていたことを表す。
過去の地図と過去の地図の比較:過去形か過去完了形
過去完了形
By 2010, the library had been replaced with an art museum.
2010年の時点では図書館は美術館になっていた。
過去形
The library was replaced with an art museum.
図書館は美術館になった。(地図からでは今はどうなってるか分からないが少なくとも過去に美術館になったことは事実)
過去の地図と現在の地図の比較:過去形か現在完了形
過去形は過去の事実のみ、現在完了形は過去のことが現在まで続いていることを表すが、現在の地図がある場合過去形を使っても現在もその状態であることは事実なので、過去形と現在完了形を厳密に区別する必要性は低い。
現在完了形
The library has been replaced with an art museum.
図書館は美術館になった(美術館になった状態が続いており今も美術館のままである)。
過去形
The library was replaced with an art museum.
図書館は美術館になった。
過去形はreplaceされた過去の事実のみを表すが、現在の地図から今も美術館であることは明らかなので過去形でもよい。
現在完了形
The footpath has been changed to a cycling road.
歩道はサイクリングロードになった(いまもサイクリングロードのままである)。
過去形
The footpath was changed to a cycling road.
歩道はサイクリングロードになった。
過去形はchangeされた過去の事実のみを表すが、現在の地図から今もサイクリングロードであることは明らかなので過去形でもよい。
過去/現在の地図と未来の地図の比較:過去形/現在形と未来形か未来完了形
未来完了形:「何年までにどうなっている」は未来完了形で表すことができる。
Demolition of the university buildings will have been completed by 2030.
(大学校舎の解体は2030年に完了する予定です)
未来の表現方法もチェックしておいてください。
プロセス
順番に現在形を使ってプロセスを書いていく。
IELTSライティングTask 1での未来の表現方法
ダイナミック/スタティック グラフ・表
be expected (to do), expectedly, expect
It is expected that the figure will increase continuously from 2023 to 2025.
この数字は2023年から2025年まで継続的に増加すると予想される。
The figure is expected to increase continuously from 2023 to 2025.
この数字は2023年から2025年まで継続的に増加すると予想される。
The continuous increase of the figure is expected from 2023 to 2025.
2023年から2025年にかけて継続的な増加が予想される。
Expectedly, the figure will increase continuously from 2023 to 2025.
2023年から2025年にかけて継続的な増加が予想される。
Experts/people expect that the figure will increase continuously from 2023 to 2025.
専門家/人々は2023年から2025年にかけて継続的な増加を予想している。
be projected / predicted (to do)
be forecast / estimated (to do)
地図
planned/scheduled
The library, which is currently on the east side of the city, is planned to be relocated to the north side.
現在市の東側にある図書館は、北側に移転する予定である。
The museum is scheduled to be renovated to facilitate a new step-free access toilet.
博物館は、新しい段差のないトイレを設置するために改修される予定である。
plan (名詞)
The university has a plan to renovate the library to install new computers and printers.
大学は、新しいコンピューターとプリンターを設置するために図書館を改修する計画である。
be (due) to do
The road is to be paved and trees are to be planted alongside the pavement.
道路は舗装され、舗装に沿って木が植えられる予定です。
The hospital is due to be constructed next to the school in 2030.
病院は2030年に学校の隣に建設される予定です。
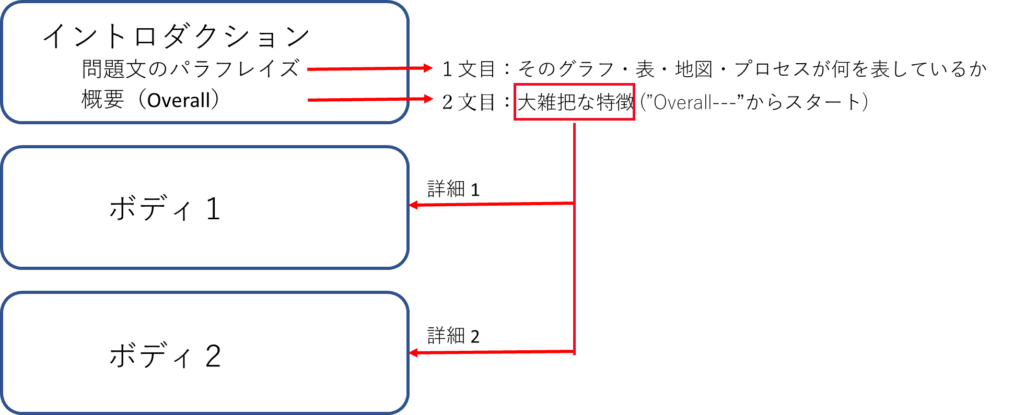
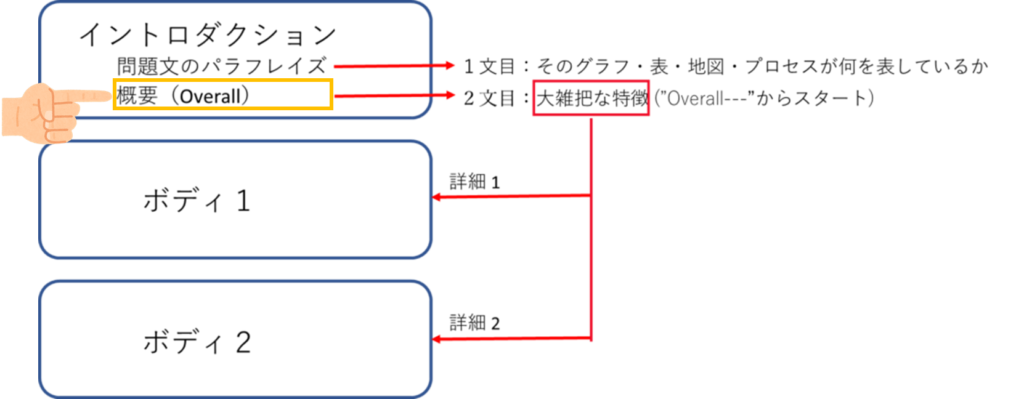
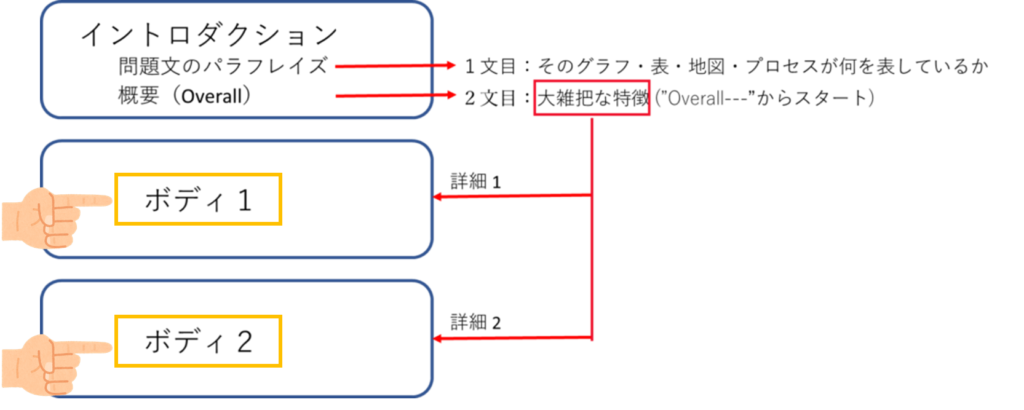
IELTSライティングTask 1の書き方(Task 1のパラグラフ構成)
IELTSライティングTask 1のパラグラフ構成|スコアアップのための基本ルール
IELTSライティングTask 1で高得点を狙うには、論理的でわかりやすいパラグラフ構成が不可欠です。基本は イントロダクション → ボディ1 → ボディ2 の3パラグラフ構成。このシンプルな構成を守ることで、採点官に明確な印象を与えられます。
ボディパラグラフの分け方|グラフ・表・地図・プロセスの特徴を整理
Task 1では、与えられた情報を分析し、2つのグループに分けて説明することが重要です。
- イントロダクション:グラフ・表・地図・プロセスの概要+全体の特徴(グループ①とグループ②の概要)
- ボディ1:グループ①をまとめる
- ボディ2:グループ②を整理する
この方法で、情報を網羅しつつ、論理的な流れを維持できます。
パラグラフの見やすさを工夫する|1行空けて境目を明確に
各パラグラフの間には必ず 1行のスペース を入れ、構成をはっきりさせましょう。視覚的に読みやすい文章は、採点官に好印象を与えます。
IELTSライティングTask 1|イントロダクションの書き方とポイント
IELTSライティングTask 1で高得点を取るためには、イントロダクションの構成が非常に重要です。イントロダクションでは、問題に出てくる グラフ・表・地図・プロセスが何を示しているのか(1文目) と、全体の特徴を簡潔にまとめる(2文目) の2ステップで書きます。
1文目:パラフレイズで問題文を言い換える
Task 1の最初の文では、与えられたグラフ・表・地図・プロセスが何を表しているのかを説明します。ここで重要なのは、問題文をそのまま書くのではなく、意味を変えずに別の言い方で表現する(パラフレイズ)ことです。
問題文)The graph below shows the number of tourist and business person vising Japan between 2010 and 2020.
下のグラフは、2010年から2020年の間に日本を訪れた観光客とビジネスマンの数を示したものである。
👉この問題文の文を意味は同じで違う言い方で書く
2文目:Overallで全体の特徴を示す
次に、“Overall, …” で始めて、全体の傾向や特徴を簡潔にまとめます。ここでは、細かい数字は入れず、大きな特徴を一言で伝えることがポイントです。
詳しくはイントロダクション・Overallにて
IELTSライティングTask 1|ボディ1とボディ2の書き方とポイント
IELTSライティングTask 1で高得点を取るためには、ボディパラグラフの構成が非常に重要です。ボディ1とボディ2では、グラフ・表・地図・プロセスの大きな特徴を詳しく説明します。イントロダクションで書いた Overallの内容を具体化するイメージです。
比較を必ず入れる
要素が複数ある場合は、必ず比較を取り入れましょう。比較をすることで、論理的な文章になり、採点官に「分析力がある」と評価されます。
数字を使って説明する
グラフや表の場合、数字を入れて特徴を説明することが必須です。ただし、細かい数値や不要な情報は避け、主要な傾向や差に焦点を当てます。
各パラグラフの文字数
各パラグラフに文字数制限はありませんが、全体的な感覚としてボディパラグラフがイントロダクションパラグラフより大きくなる感じが理想です。
20%~30%
35%~40%
35%~40%
イントロダクションパラグラフ (パラグラフ1)
IELTSライティングTask 1対策|イントロダクションとパラフレイズの書き方
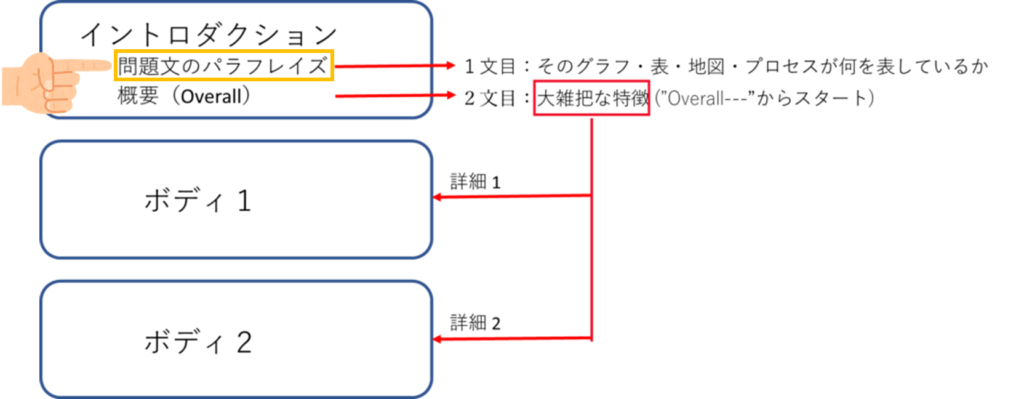
パラフレイズとは?
IELTSライティングTask 1で高得点を取るためには、イントロダクションパラグラフの質が非常に重要です。最初の1文は、問題に出てくる グラフ・表・地図・プロセスが何を示しているのかを説明します。このとき、問題文(Ex. The chart below shows —)をそのまま書くのはNG。必ず パラフレイズ(言い換え) を使いましょう。
パラフレイズとは、意味を変えずに違う単語や表現で書き換えることです。日本語でも、「このグラフは日本の年間降水量を月別に示している」をパラフレイズすると「このグラフは日本の1年を通しての雨量を各月毎に示している」にできる。
パラフレイズのスキルは大学で論文を作成する際に必ず使う。例えば他の参考文献での内容を自分の論文に参照させるときには、ただコピペするのではなくパラフレイズして自分の論文に入れることが要求される。
(Q:問題文)
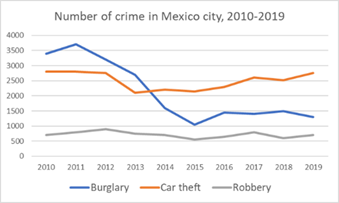
The chart below shows the changes that took place in three different areas of crime in Mexico City from 2010 to 2019.
下のグラフは、メキシコシティの3つの犯罪分野における2010年から2019年の間の変化を示したものである。
(P:パラフレイズ)
The line graph illustrates how the number of criminal incidents in three categories in Mexico City changed between 2010 and 2019.
折れ線グラフは、メキシコシティにおける3つの犯罪の発生件数が2010年から2019年の間にどのように変化したかを示している。
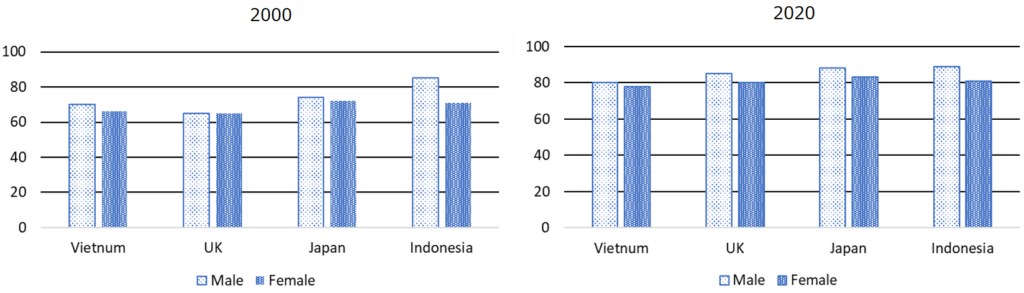
(Q:問題文)
The charts show information about the percentage of men and women aged 60-64 who were employed in four countries in 2000 and 2020.
グラフは、2000年と2020年に4カ国で雇用された60歳から64歳の男女の割合に関する情報を示している。
⇓
(P:パラフレイズ)
The two bar graphs compare four countries in terms of the proportion of males and females in employment aged between 60 and 64 in 2000 and 2020.
2つの棒グラフは2000年と2020年に60歳から64歳までの男女の就業者の割合を比較している。
パラフレイズのやり方
問題文のパラフレイズ(最初の1文目)で時間を使い過ぎないようにパラフレイズの方法を事前に覚えておく。
それぞれの説明は下の解説をご覧ください👇👇👇

1.必ず問題文に入っている動詞のパラフレイズ
結構多くの頻度で”give information on—”か”show”が問題文に使われている。これらは必ずillustrate, demonstrate, compareなど違う動詞に置き換える。
(Q) : Question / (P) : Paraphrase
「—を示している」
(Q) give information on—/show ⇔ (P) illustrate ⇔ (P) demonstrate
「—について—を比較している」
(Q) give information on—/show ⇔ (P) compare — in terms of — ⇔ (P) compare — across (A and B) ⇔ (P) provide a comparison between -A- and -B-.
compare — across — (A and B)の使い方
This graph compares the trends of electricity demand in a day across summer and winter.
グラフは夏と冬の1日の電力需要の推移を比較している。
The pie chart compares the proportion of water consumption across six different categories.
円グラフでは、水の消費量の割合を6つのカテゴリに分けて比較しています。
(six different categories: 6つに分けられたフィールド間(industry, residential, business…)での比較)
The table compares the proportion of young children studying English across four types of secondary schools in 2000, 2005 and 2009.
この表では、2000年、2005年、2009年に4つの種類の中学校で英語を学ぶ子供たちの割合を比較しています。
2.動詞以外の単語のパラフレイズ
その他動詞関係(過去分詞/現在分詞)のパラフレイズ
(Q) amount of goods transported ⇔ (P) amount of goods carried
(Q) when they go to live in other countries ⇔ (P) when they move to foreign countries
名詞をパラフレイズ (Google: 〇〇〇 synonym(同意語)で検索)
(Q) percentage ⇔ (P) proportion (proportion: 割合(%)は頻出単語なので必ず覚える)
(Q) (line) chart⇔(P) (line) graph
(Q) use ⇔ (P) consumption
(Q) demand (for) ⇔ (P) need (for)
(Q) projections ⇔ (P) predictions : 未来の場合
(Q) (from) outside of the country ⇔ (P) (from) different regions/foreign countries
(Q) (by) country of origin ⇔ (P) (by) original nations
(Q) amount of goods transported ⇔ (P) quantity of goods transported
(Q) pupils ⇔ (P) young children
(Q) challenges that people face⇔ (P) difficulties that people face
(Q) kinds of ⇔ (P) genres of
(Q) area ⇔ (P) category
(Q) January ~ December ⇔ (P) in the springtime(春季) / in the summertime(夏季) / in the autumntime(秋季) / in the wintertime(冬季)
3.名詞 を ”how + 動詞”にパラフレイズ
(Q) changes that took place in three different areas of crime
⇔ (P) how the number of incidents of crime in three categories changed
(Q) changes of the arrangement ⇔ (P) how the arrangement changed
(Q) process of car manufacturing ⇔ (P) process of how cars are manufactured
4.期間をパラフレイズ
(Q) yearly ⇔ (P) annually
(Q) in 2025 ⇔ (P) in the year 2025
(Q) every year ⇔ (P) annual
(Q) weekly ⇔ (P) per week
(Q) yearly ⇔ (P) per year
(Q) from 2003 to 2008⇔ (P) between 2003 and 2008
(Q) in 1980, 2000 and 2020 ⇔ (P) from 1980 to 2020 at two-decade intervals
何年刻みでと書くときは必ずハイフン(-)を入れて、intervalsと複数形にする。
at five–year intervals = 1995 → 2000 → 2005 → 2010
at two–decade intervals = 1950 → 1970 → 1990 → 2010
(Q) for two weeks ⇔ (P) over a two-week period
(Q) from January to December⇔ (P) throughout a year / over a year
(Q) from 2000 ⇔ (P) from 2000 onwards (2000年以降続く場合)
The population in Japan began to decrease from 2000 onwards.
日本の人口は2000年から減少に転じました。
5.少し具体的にパラフレイズ
(Q) charts ⇔ (P) pie charts
(Q) sales ⇔ (P) sales figures/data
(Q) price of tickets on one airline ⇔ (P) fluctuations in airline ticket price
(Q) consumption of dairy products ⇔ (P) amount of milk and butter consumed
(Q) university sports courts ⇔ (P) layout of sports facilities in a university
(Q) residents living in Australia ⇔ (P) the number of residents in Australia
(Q) according to different nationalities and areas ⇔ (P) by nationalities and their residing areas
(Q) in some countries ⇔ (P) in four countries (nations)
(Q) total number of minutes of telephone calls ⇔ (P) how many minutes people in the UK spent on phone calls
(Q) in two seasons ⇔ (P) in summer and winter
(Q) genres of books sold by a bookseller ⇔ (P) categorised breakdown of books sold by a bookseller
(Q) expertise ⇔ (P) a high level of knowledge or skills.
6.関係代名詞使ってパラフレイズ
(Q) amount of goods transported ⇔ (P) quantity of goods which were carried
(Q) number of visitors in the UK ⇔ (P)number of people who visited the UK
(Q) books sold by a bookseller ⇔ (P) books which were sold by a bookseller
7.その他パラフレイズ
(Q) and ⇔ (P) as well as
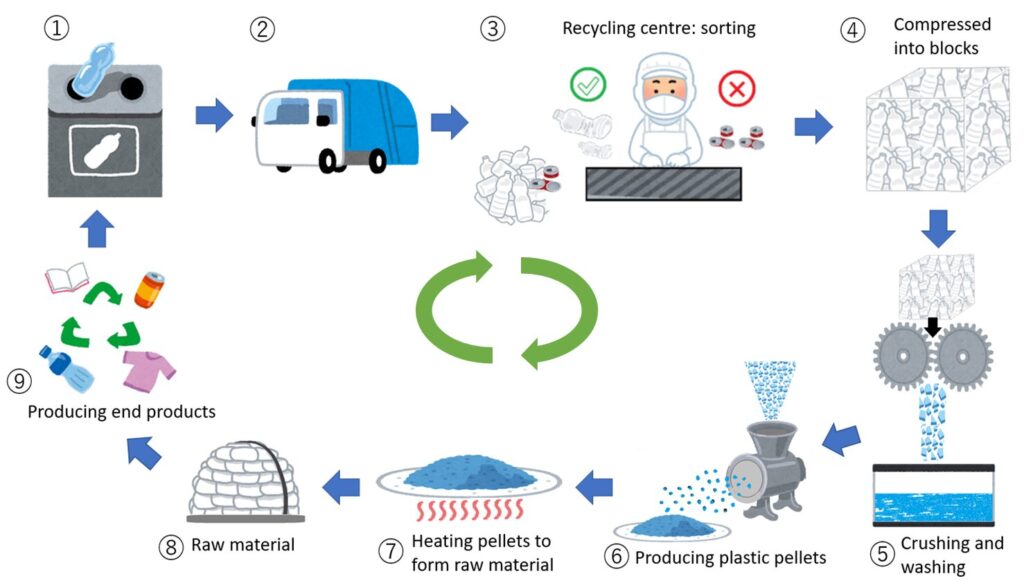
プロセスの場合のパラフレイズ
プロセスの場合は以下の表現で—の工程を表現することで問題文をパラフレイズできる。
of —ing
This diagram illustrates the process of recycling plastic bottles.
この図はペットボトルのリサイクルのプロセスを示しています。
how
This diagram illustrates how plastic bottles are recycled.
この図はペットボトルのリサイクルのプロセスを示しています。
by which
This diagram illustrates the process by which plastic bottles are recycled.
この図はペットボトルのリサイクルのプロセスを示しています。
IELTSライティングTask 1対策|イントロダクションの2文目「Overall」の書き方
IELTSライティングTask 1で高得点を取るためには、イントロダクションパラグラフの2文目が重要です。1文目で問題文をパラフレイズした後、2文目ではそのブラフ/表/地図/プロセスにどんな特徴があるのかをざっくりと全体の傾向(Overall) を簡潔にまとめます。
Overall文の役割
概要(Overall)文は、グラフ・表・地図・プロセスの 大きな特徴や傾向をざっくりと示すための文です。ここでは細かい数字は使わず、次のような情報を含めます:
- 全体的な増加・減少の傾向
- 最も大きい要素と最も小さい要素
- 目立つ特徴やパターン
ダイナミックグラフ・表のOverall文の書き方
ダイナミックグラフ・表のOverall—は期間の最初と最後を比較して増えた/減ったの傾向を書く。
ダイナミックグラフ・表のOverall文を書くのに使える単語・表現
Trend
時間の経過による変化があるダイナミックグラフ/表で、どの様な傾向があるのかを書くのには”Trend“は最もよく使える表現なので必ず覚えておく。(2つの年を比較してトレンドというのは微妙、3つ以上の年が出てきた場合に使う方がよい)
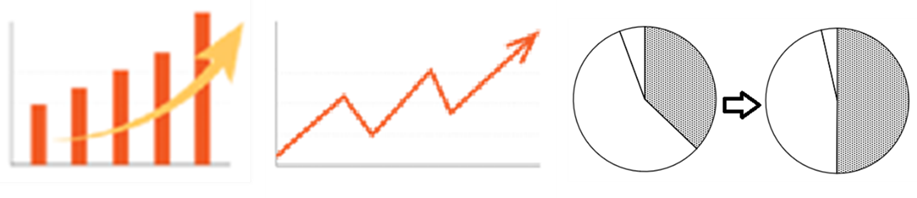
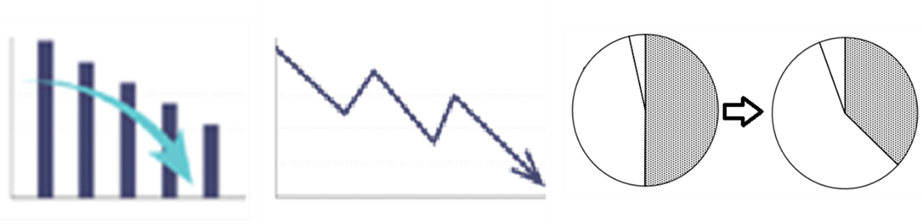
上っている傾向にある:an upward trend / an increasing trend / a growing trend
下がっている傾向にある:a downward trend/ a decreasing trend / a declining trend
どのようなTrendかを表すのに使える動詞はshow, see, undergo, experienceの4つをおさえる。(同じ動詞の繰り返しではスコアはでないので、上がっているTrendと下がっているTrendで動詞は変える)
The amount of meat exported underwent an upward trend, while that imported saw a downward trend.
食肉の輸出量は増加傾向にあった一方で、輸入量は減少傾向にあった。
The population of London showed an increasing trend, while that of Tokyo underwent a decreasing trend.
ロンドンの人口は増加傾向にあった一方で、東京の人口は減少傾向にあった。
The sales of electric cars in Japan experienced a growing trend, while that of diesel cars saw a declining trend.
電気自動車は増加傾向にあった一方で、ディーゼル車は減少傾向にあった。
There was an upward/a downward trend in the number of exports from Japan.
日本からの輸出の数は増加/減少傾向だった。
対比表現
傾向(Trend)や比較を書く場合には、接続詞、副詞、前置詞(句)を用いて項目を比較する。イントロダクションで不必要に時間を取られないように各パターンを覚えておくこと。
増えたグループと減ったグループを対比させて、「—は増えたが、一方—は減った」と書く。
接続詞:while / whereas (whereasは文頭では使えない)
The export of furniture showed an upward trend, while/whereas that of computers underwent a downward trend.
家具の輸出は増加傾向にあった一方で、コンピュータは減少傾向にあった。
副詞:conversely, However (反対に), similarly (同様に), meanwhile (一方で)
The export of furniture showed an upward trend. Conversely, the trade volume of computers underwent a downward trend.
家具の輸出は増加傾向にあった。反対に、コンピュータは減少傾向にあった。
The export of meat showed an upward trend. Similarly, the trade volume of fish exported increased during the period surveyed.
食肉の輸出は増加傾向にあった。 同様に、魚の輸出量も調査期間中に増加した。
前置詞(句):unlike, in comparison, on the other hand, contrary to
Unlike the export of furniture, which showed an upward trend, the trade volume of computers underwent a downward trend.
家具の輸出が増加傾向にあったのに対し、コンピュータは減少傾向にあった。
The export of furniture showed an upward trend. In comparison, the trade volume of computers underwent a downward trend.
家具の輸出が増加傾向にあった。 一方、コンピュータは減少傾向にあった。
The export of furniture increased during the period. On the other hand, the trade volume of computers underwent a downward trend.
家具の輸出が期間中増加した。 一方、コンピュータは減少傾向にあった。
Contrary to furniture sales, which continuously increased over the period, those of computers showed no change.
期間をとおして売上げが継続的に上がった家具の売り上げとは反対に、コンピューターの売り上げは変化がなかった。
比較級
項目の比較を入れながら全体の傾向を書くこともできる。
A higher amount of energy is consumed in winter than in summer.
エネルギー消費量は夏より冬の方が多い。
The typical daily demand for electricity in England is generally higher in winter than in summer.
イギリスの一般的な1日の電力需要は、夏より冬の方が多い。
スタティックグラフ・表のOverall文の書き方
スタティックグラフ/表はダイナミックとは異なり時間の経過による変化がない。なので、どの様に変化したかではなく、どのような状態なのか大きな特徴を書く。具体的には、
- 一番大きいもの/小さいものは何か?
- 大半を占めるもの(Majority)と少数派のもの(Minority)は何か?
比較できれば、一番大きいものと一番小さいものの比較、MajorityとMinorityの比較を書く。
スタティックグラフ・表のOverall文を書くのに使える単語・表現
最上級
いちばん大きい・多い
Meat sales represented the highest proportion in 2020.
2020年には肉の売上が最も高い割合を占めました。
Tennis was the most popular of all the games played on the annual day.
年に1度の日に行われる全てのゲームの中でテニスが最も人気があった。
Meat was the most sold product in 2020.
肉は2020年に最も売れた商品でした。
The most sold product in 2020 was meat.
2020年に最も売れた商品は肉でした。
いちばん小さい・少ない
Meat sales represented the lowest proportion in 2020.
2020年には肉の売上が最も低い割合を占めました。
Tennis was the least popular of all the games played on the annual day.
年に1度の日に行われる全てのゲームの中でテニスが最も人気がなかった。
Meat was the least sold product in 2020.
2020年に最も売れなかった商品は肉でした。
The least sold product in 2020 was meat.
2020年に最も売れなかった商品は肉でした。
比較級
A higher/greater amount of energy is consumed in winter than in summer.
エネルギー消費量は夏よりも冬の方が多いです。
The typical daily demand for electricity in England is generally higher in winter than in summer.
イギリスの一般的な1日の電力需要は、一般的に夏よりも冬の方が多いです。
A lot more people live in cities than the countryside.
地方よりも都市部に住む人の方がはるかに多い。
Exports from the UK to European nations are higher than those to Asian countries, except for the electrical and instrument engineering sectors.
イギリスからヨーロッパ諸国への輸出は、電気計器工学分野を除いて、アジア諸国への輸出よりも多い。
大半を占める (majority, over half, sizable)
Meat sales took the majority share of international trade in 2020.
食肉の販売は2020年の国際貿易の大部分を占めた。
The majority of energy is consumed for heating purposes in winter.
エネルギーの大部分は冬の暖房目的で消費される。
The vast majority of water use in Japan is in the residential sector, and the biggest uses of that water are for bathrooms and gardens.
日本の水使用の大部分は住宅向けであり、その最大の用途は浴室と庭である。
Over half of the water that was used in residential areas was consumed in bathrooms and gardens.
住宅地域で使用された水の半分以上は浴室と庭で消費された。
Meat accounted for a sizeable proportion of international trade in 2020.
2020年の国際貿易の中で食肉はかなりの割合を占めていた。
a number of —は「いくつかの」「何人かの」の意味で”多くの”の意味ではない。
“多くの”を表すにはsignificantやlargeをつける。
add a number of new features for —:—のためのいくつかの新機能を追加する
add a significant number of new features for —:—のための多くの新機能を追加する
少数派 (minority)
The minority of the students decided to study further on a postgraduate course.
少数の学生は大学院でさらに勉強することを決めた。
Those who did advanced study while working part-time represented a small minority of the students.
アルバイトをしながら大学院での勉強をしている学生は少数派であった。
相関関係(correlation)がある
The graph shows a correlation between individuals’ professions and the likelihood of owning luxury cars.
そのグラフは個人の職業と高級車を持つ傾向の相関関係を示している。
There is a correlation between the amount of individuals’ body fat and their time spent on sports.
体脂肪の量と運動に費やした時間の間には相関があった。
There is a correlation between average income and the number of crimes.
平均収入と犯罪件数には相関関係があります。
The number of crimes has a correlation with average income and standard of living.
犯罪件数は平均収入と相関関係があります。
対比表現
ダイナミックグラフ/表と同じように項目の比較は必ず意識する。その際に、ダイナミックと同じように接続詞、副詞、前置詞(句)を用いて、項目を対比させて、「—が一番大きい、一方—は一番小さい」などと書く。
接続詞:while / whereas (whereasは文頭では使えない)
Furniture sales took the largest share, while/whereas those of computers was the smallest.
家具の売上げが最も多く、コンピュータの売上げが最も少なかった。
Young people face difficulties in making friends, while/whereas older people face problems in learning the language of a foreign country.
若者は友達作りに苦労し、高齢者は外国語の習得に苦労している。
The oldest group drink milk the most, while/whereas those in the young group eat butter the most.
高齢者は牛乳を最も多く飲み、若者はバターを最も多く食べる。
副詞:conversely (反対に), meanwhile (一方で)
Furniture sales generated the largest profit. Conversely, the sale of computers brought the smallest revenue. (Furniture sales: 家具の売上げ(数値)、sale: 販売(活動))
家具の販売が最も大きな利益を生み出した。 逆に、コンピュータの販売が最も小さな収益をもたらした。
前置詞(句):unlike, in comparison, on the other hand, compared to, in contrast to
Unlike furniture sales, which generated the largest profit, the sale of computers brought the smallest revenue. (Furniture sales: 家具の売上げ(数値)、sale: 販売(活動))
家具の販売が最も大きな利益を生み出したのとは異なり、コンピュータの販売が最も小さな収益をもたらした。
Furniture sales generated the largest profit. In comparison/On the other hand, the sale of computers brought the smallest revenue. (Furniture sales: 家具の売上げ(数値)、sale: 販売(活動))
家具の販売が最大の利益を生み出した。 一方、コンピュータの販売は最小の収益をもたらした。
In terms of butter consumption, younger people use / eat the least at just 15g per day, in contrast to 30g for those over the age of 60.
バターの消費量に関しては、60歳以上の人が30g/日であるのに対し、若い人はわずか15g/日で最も消費/摂取量が少ない。
Compared to/In comparison with sales of furniture and toys, the revenue from computers and kitchen appliances was minuscule.
家具とおもちゃに比べて、コンピューターとキッチン用品の売り上げからの利益はとても少なかった。
その他傾向を表す表現
傾向にある:tend to
People over 55 years old tend not to have trouble finding new accommodation, compared to those in the other age groups.
55歳以上の人は、他の年齢層に比べて新しい住居を見つけるのに苦労しない傾向がある。
Australians tended to prefer living in rural areas.
オーストラリア人は田舎に住むことを好む傾向がある。
Younger people tend to consume less milk and butter, especially teenagers.
若い人、特に10代の若者は牛乳とバターの消費量が少ない傾向がある。
傾向にある:likely
Australians are more likely to live in the countryside with one fifth of them doing so.
オーストラリア人は田舎に住む可能性が高く、1/5(20%)がそうしている。
傾向にある:opt for
Students studying science opt for taking classes of math and physics.
理系の学生は数学と物理の授業を選択する傾向がある。
地図のOverall文を書くのに使える単語・表現
地図のOverallは大雑把にものを表す単語(facilities, equipment, amenities, buildings, road)と大雑把に変化を表す単語(modification, amendment, replacement)を使って書く。
現状と未来の計画の比較の場合:
(Overall,) this development includes / will include increasing the number of boarding gates, adding new facilities and relocating the existing facilities.
(全体的に) この開発には、搭乗ゲートの数の増加、新しい施設の追加、既存の施設の移転が含まれる。
(Overall,) the principal change will be the increase in the number of laboratories and the relocation of the main road running through the campus.
(全体的に) 主な変更は、研究室の数の増加とキャンパスを通る幹線道路の移転である。
(Overall,) the major change planned is the addition of a new science department on the left side of the university.
(全体的に) 主な変更は、大学の左側に新しい理学部が追加されることである。
過去と現在の比較の場合:
(Overall,) dramatic amendments were seen in the library in terms of its facilities and equipment.
(全体的に) 図書館の施設と設備の面で劇的な変更が見られた。
(Overall,) this development included / has included increasing the number of boarding gates, adding new facilities and relocating the existing facilities.
(全体的に) この開発には、搭乗ゲートの数の増加、新しい施設の追加、既存の施設の移転が含まれている。
(Overall,) the university has undergone many improvements in terms of access to the laboratories.
(全体的に) 大学は研究室へのアクセスの面で多くの改善を受けた。
プロセスのOverall文を書くのに使える単語・表現
プロセスのOverallには、次の3つを入れる。
1.工程数
2.circular process か linear process
- Circular process : リサイクル(製品の処分→リサイクル(製品)→製品の処分)など一周まわるプロセス
- Linear process : 何かを作る工程(作って終わり)のプロセス)
3.何から始まり何に終わるのか
この3つを入れる表現として、次の動詞と表現は必ず覚えておく
contain
(Overall,) it is a circular process containing nine stages from collecting used bottles to making recycled products.
(全体) 使用済みボトルの回収からリサイクル製品の製造までの9つの工程からなる循環(circular)プロセスです。
consist of
(Overall,) this is a linear process which consists of eleven steps from drying animal skin to making the final leather products.
動物の皮の乾燥から最終的な革製品の製造までの11の工程からなる直線的な(linear)プロセスです。
comprise of
(Overall,) this circular process is comprised of three main stages including collection, followed by cleaning, and finally producing some items.
(全体) この循環的なプロセスは、収集、洗浄、最終的な製品の製造を含む3つの主要な段階で構成されています。
There are
(Overall,) there are three main steps / procedures to this entirely manual process.
この完全に手動のプロセスには、3つの主要なステップ/手順があります。
(Overall,) there are seven steps in the production of the automobiles.
自動車の生産には7つのステップがある。
Take
(Overall,) the production process of the automobiles takes seven days in total.
自動車の生産プロセスは合計で7日間かかる。
—から始まり—までの: beginning with —, followed by —
(Overall,) there are three main procedures to this entirely manual process beginning with initial transportation of the raw material to the factory, followed by preparation and processing of the material, and finally the manufacture of consumer products.
(全体) この完全に手動のプロセスには、3つの主要な手順があります。原材料の工場への輸送から始まり、その後の材料の準備と加工、最後に消費者製品の製造です。
IELTSライティングTask 1対策|イントロダクションのOverall文のサンプル
IELTSライティングTask 1で高得点を取るためには、イントロダクションパラグラフの2文目(Overall文)が非常に重要です。1文目で問題文をパラフレイズした後、2文目では 全体の傾向や特徴を簡潔にまとめる必要があります。
全体の傾向に例外がある場合には「一部を除いて(except for —)、全体では—」の書き方でよい。
例)Overall, most categories showed an upward trend, except for clothing, which remained stable.
Overallで全体の傾向を書いた後に追加で書く特徴があれば、Furthermore, —として入れる。例)「(期間を通してAとBの売り上げは上昇傾向だった)Furthermore, Aの売り上げは常に最も大きかった」など。
例)Overall, sales of A and B increased throughout the period. Furthermore, A consistently had the highest figures.
ダイナミックグラフ・表 イントロダクションOverall文サンプル
イントロダクションOverall文サンプル1:棒グラフ
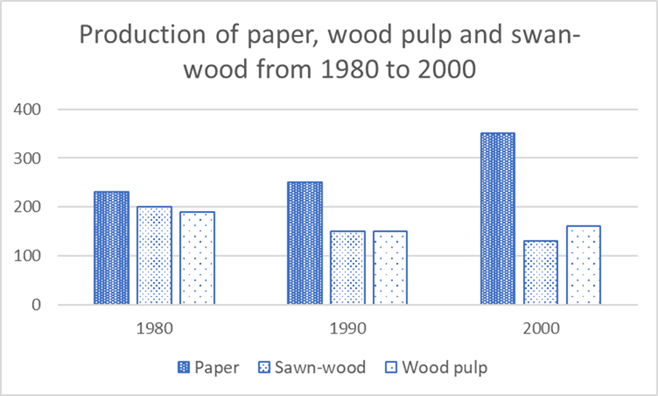
The line graph illustrates the amount of paper, sawn-wood and wood pulp produced between 1980 and 2000 at ten-year intervals. Overall, the production of paper underwent an upward trend, whereas manufacturing of the other materials showed a downward trend over the period. Furthermore, the production of paper was always the highest over the 20 years.
折れ線グラフは、1980年から2000年までの紙、製材、木材パルプの生産量を10年間隔で示している。全体として、紙の生産量は増加傾向にあるが、他の素材の生産量は減少傾向にある。さらに、紙の生産量は20年を通じて常に高かった。
この後Body 1にproduction of paperがどのように増えたのか、Body 2にmanufacturing of the other materialsがどのように減ったのかを書く。
イントロダクションOverall文サンプル2:円グラフ
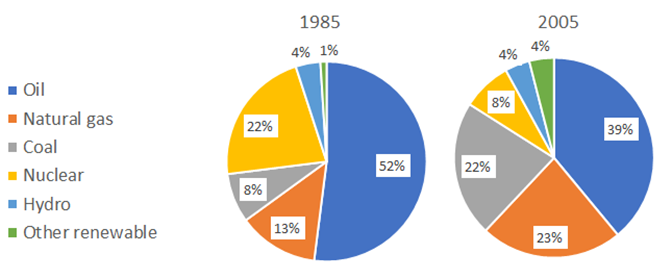
Sample 1
The pie charts compare percentages of energy made from several sources in one country in 1985 and 2005. Overall, electricity production from oil and nuclear power decreased whereas that from natural gas, coal and various renewable sources increased. Furthermore, fossil fuel represented the largest share, even after the energy shift.
円グラフは、1985年と2005年のある国における複数のエネルギー源から作られた発電量の割合を比較したものである。全体として、石油と原子力からの発電量は減少し、天然ガス、石炭、再生可能エネルギー源からの発電量は増加した。さらに、エネルギーシフト後も化石燃料が最大の割合を占めていた。
Sample 2 (同じ問題)
The pie charts compare percentages of energy made from several sources in one country in 1985 and 2005. Overall, this country experienced an energy shift by reducing the use of oil and nuclear power and relying more on natural gas, coal and various renewable sources. Furthermore, fossil fuel represented the largest share, even after the energy shift.
円グラフは、1985年と2005年の一国における複数のエネルギー源から作られた発電量の割合を比較したものである。 全体として、この国は石油と原子力の使用を減らし、天然ガス、石炭、再生可能エネルギー源への依存を高めることでエネルギーシフトをした。さらに、エネルギーシフト後も化石燃料が最大の割合を占めていた。
この後Body 1にreducing the use of oil and nuclear powerの詳細、Body 2にrelying more on natural gas, coal and various renewable sourcesの詳細を書く。
イントロダクションOverall文サンプル3:表
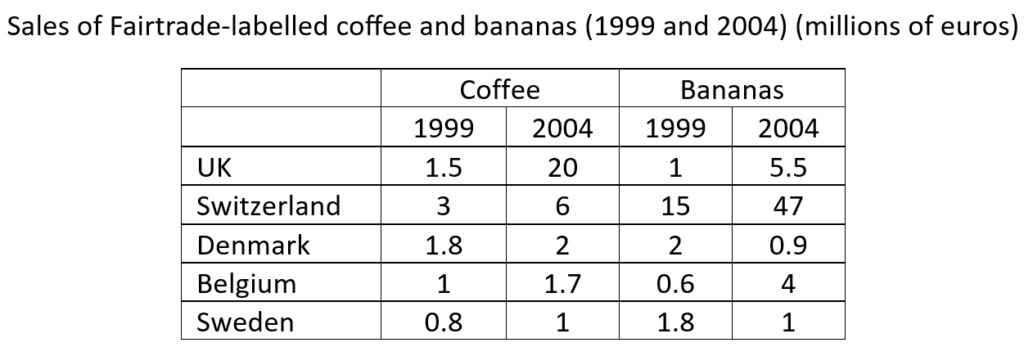
The table gives an account of sales figures of Fairtrade-labelled coffee and bananas in five countries in Europe in 1999 and 2004. Overall, except for sales of bananas in Sweden and Denmark, the sales figures of both items increased during the given five years.
この表は、1999年と2004年の欧州5カ国におけるフェアトレードラベルのコーヒーとバナナの売上高を示している。全体としては、スウェーデンとデンマークのバナナの売上高を除いて、両品目の売上高はこの5年間で増加している。
この後both items (bananaとcoffee)のsalesについてBody 1にbananaの傾向、Body 2にcoffeeの傾向を書いく
スタティックグラフ・表 イントロダクションOverall文サンプル
イントロダクションOverall文サンプル1:表
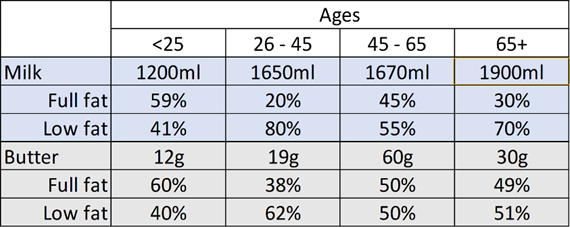
The table illustrates the amount of milk and butter consumed per week across four age groups in one European country. Overall, the oldest group drinks milk the most and the 45-65 range group eats butter the most, whereas the youngest group consumes both milk and butter the least.
この表は、欧州のある国における4つの年齢層の1週間あたりの牛乳とバターの消費量を示している。 全体としては、最も高齢のグループが牛乳を最も多く飲み、45-65歳のグループがバターを最も多く食べるのに対し、最も若いグループは牛乳とバターの両方の消費量が最も少ない。
この後ボディ1にmilk、ボディ2にButterの年齢別消費量を書く
イントロダクションOverall文サンプル2:表
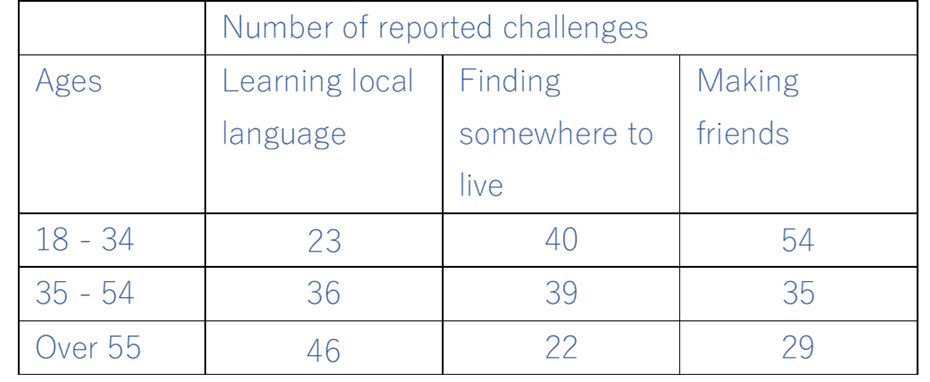
The table illustrates the proportion of difficulties that people face when they move to foreign countries according to different age groups. Overall, as people get older, they find it more challenging to speak foreign languages, but they struggle less with making new friends. Furthermore, people over 55 years old tend not to have trouble finding new accommodation, compared to those in other age groups.
この表は、年齢層別に外国に移住する際に直面する困難の割合を示している。 全体的に、年齢が上がるにつれて、外国語を話すことはより困難になるが、新しい友人を作ることに苦労することは少ない。さらに、55歳以上の人は、他の年齢層に比べて、新しい住居を見つけることに苦労しない傾向がある。
この後ボディ1にforeign languagesについて、ボディ 2にnew accommodation/making new friendsについて書く
地図 イントロダクションOverall文サンプル
イントロダクションOverall文サンプル1:地図
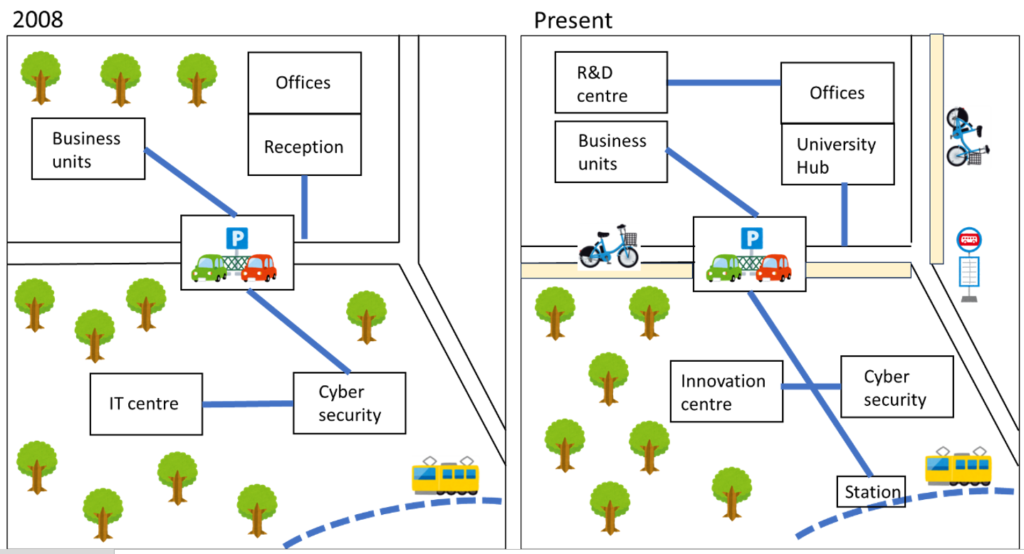
The two maps compare the layout of a science park from 2008 and the present. Overall, some new facilities have been added by eliminating some greenery, and the function of some amenities has changed. In relation to this renovation, new paths have been made to connect facilities, and a bus stop as well as cycle paths have been newly built.
2つの地図は、2008年と現在のサイエンスパークのレイアウトを比較している。 全体的には、一部の緑地を減らして新しい施設が追加され、一部のアメニティの機能が変更されている。この改修に関連して、施設を結ぶ新しい歩道が作られ、バス停とサイクルパスが新設された。
地図の1つが今のものなので現在完了でsome new facilities have been addedやthe function of some amenities has changedと書いた
この後、ボディ1に緑地に追加された施設と用途変更された施設の詳細(”some new facilities have been added by eliminating some greenery, and the function of some amenities has changed”の詳細)、ボディ2に新設された通路とバス停、自転車道路の詳細(”new paths have been made to connect facilities, and a bus stop as well as cycle paths have been newly built”の詳細)を書く
プロセス イントロダクションOverall文サンプル
Linear process
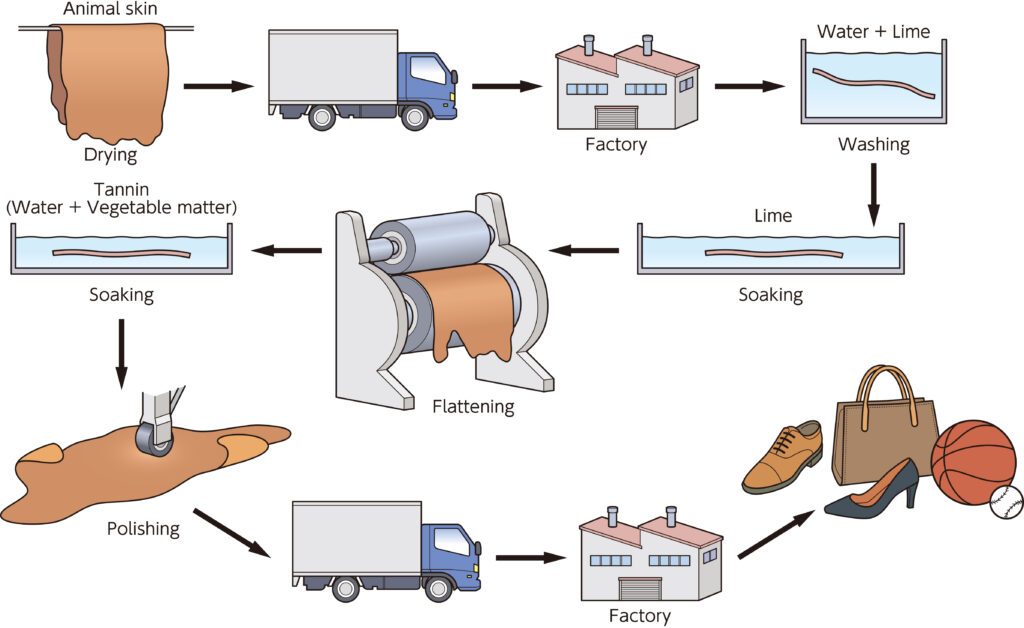
The diagram illustrates how leather products are made from animal skin. Overall, this is a linear process which consists of eleven steps from drying animal skin to making the final products.
図は、動物の皮から革製品がどのように作られるかを示している。 全体としては、動物の皮を乾燥させてから最終製品を作るまでの11の工程からなる直線的なプロセスである。
この後Body1にプロセスの前半、Body 2にプロセスの後半を書く
Circular process
The diagram illustrates how plastic bottles are recycled. Overall, it is a circular process containing nine stages with both manual and mechanical processes from collecting used bottles to making recycled products.
図は、ペットボトルがどのようにリサイクルされるかを示している。 全体としては、使用済みボトルを回収してからリサイクル製品を作るまでの、手作業と機械の両方のプロセスからなる9つの工程の循環的なプロセスである。
この後Body1にプロセスの前半、Body 2にプロセスの後半を書く。Body 2には最初の工程に戻ることを書く
ボディ1(パラグラフ2)& ボディ2(パラグラフ3)
IELTSライティングTask 1対策|ボディパラグラフの書き方
IELTSライティングTask 1で高得点を取るためには、ボディパラグラフの構成が非常に重要です。イントロダクションで書いた Overallの内容を具体化するのがボディ1(パラグラフ2)とボディ2(パラグラフ3)の役割です。
つまり、グラフ/表/地図/プロセスの特徴を大きく2分割して2つのパラグラフで書きます。
IELTSライティングTask 1対策|特徴のボディ1とボディ2への分け方
ダイナミックグラフ・表のボディ1とボディ2への分け方
ダイナミックのグラフ・表は期間の最初と最後を比較したときの”変化の傾向”でグルーピングしてボディ1とボディ2に分ける。
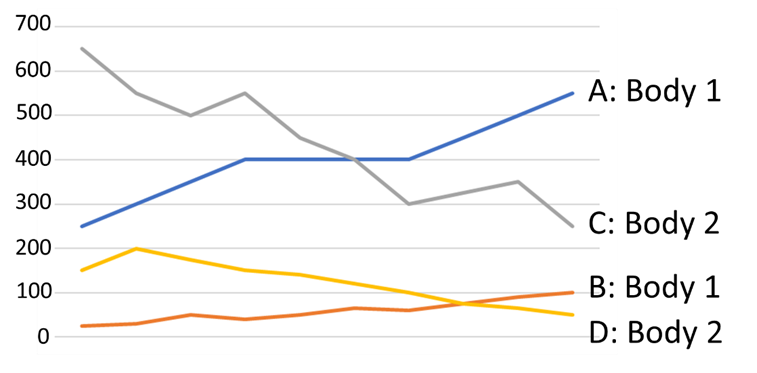
例)期間の最初と最後を比較して、
A, Bは上がっている = ボディ1
C, Dは下がっている = ボディ2
ボディ1:A, B
Line A and B underwent an upward trend. Line A, which started in second place at approximately 250, increased to 400 before levelling off at the same figure. After that, it rose to the largest figure of about 550 at the end. Line B also underwent an increase with gradual and continuous growth from just above 0, the lowest among the four lines, to nearly 100.
AとBは上昇傾向にあった。Aは約250で2位からスタートし、400まで上昇した後、同水準で横ばいとなった。その後、最後に最大の約550まで上昇した。Bも、最も低い0付近から100近くまで、緩やかに継続的に上昇した。
ボディ2:C, D
Conversely, line C and D saw a downward trend. There was a huge drop in line C from the highest at 650 to second place at 250, although it showed some fluctuations over the period. Line D started at just below 150 and climbed to 200. Then, it showed a continuous decline to the lowest point of about 50. While declining, line C and D were surpassed by line A and B at 400 and 80, respectively.
逆に、CとDは下降傾向を示した。Cは、変動はあるものの、最高値の650から2位の250まで大きく下落した。Dは、150弱から始まり、200まで上昇した。その後、連続して下降し、最低の50付近まで下降した。Cは400でAに抜かれ、Dは80でBに抜かれた。
スタティックグラフ・表のボディ1とボディ2への分け方
スタティックグラフ・表は”比較できる項目ごと”にグルーピングして、比較した特徴を説明する。(比較を入れないとただ数字を言うだけになってしまいスコアは出ない)
この表は年齢層別のMilkとButterの消費量とFull/Low fatの割合の比較を表しており、MilkとButterのそれぞれで年齢層別の比較をすることが問題の意図。
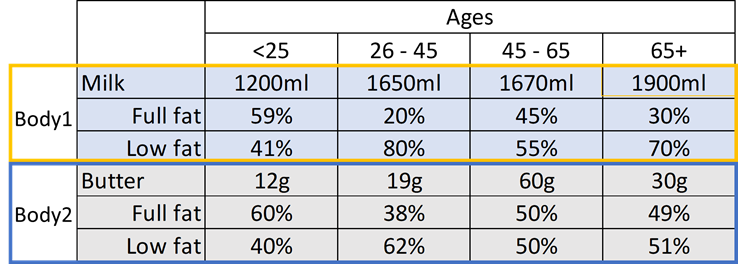
この表の場合、項目はMilkとButterの2つ
Milk の年齢層別消費量の比較= ボディ1
Butterの年齢層別消費量の比較 = ボディ2
もしボディ1:若いグループ(<25 & 26-45)、ボディ2:年配グループ(45-65 & 65+)でグルーピングしてしまうと比較ができない。
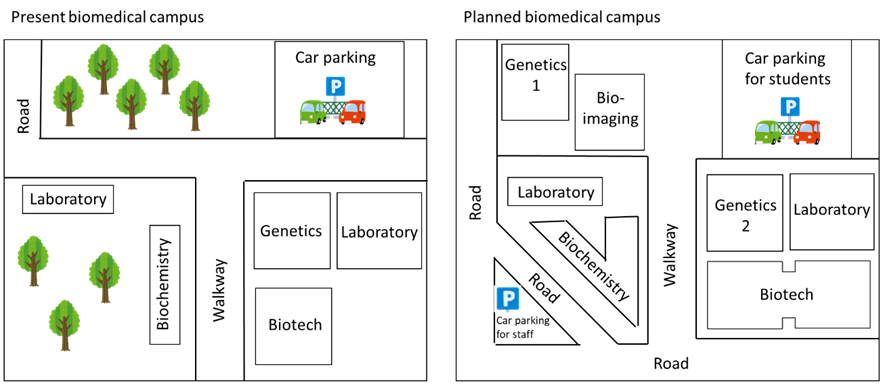
地図のボディ1とボディ2への分け方
地図の場合、地図の部分ごと(東側と西側など)に分ける場合と、要素ごとに分ける方法がある。
地図の部分ごとに変化を分ける場合
例)スポーツ施設内の配置変更:ボディ1を施設右側、ボディ2を施設左側
下の地図の場合、地図の右側の変化:ボディ1、地図の左側の変化:ボディ2 👇👇👇
要素別に変化を分ける場合
例)キャンパスの変化:ボディ1に道の変化、ボディ2に建物の変化
ボディ1に地図1の説明、ボディ2に地図2の説明にはしない。ボディ2にはボディ 1で書いた地図1の状態との比較ができるが、ボディ 1には地図1の状態しか書けず比較ができなくなる。
下の地図の場合、Road/Walkway(道路関係)の変化:ボディ1、設備(建物関係)の変化:ボディ2 👇👇👇
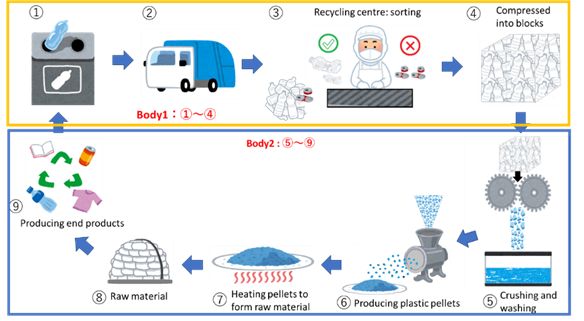
プロセスのボディ1とボディ2への分け方
プロセスの前半をBody 1に、後半をBody 2に分ける。
特に比較する要素はないのでどこで分けても基本的にはOKだが、Body 1とBody 2の分量のバランスをよくするために大体プロセスの半分で分ける。
下のプロセスの場合、プロセス前半①~④:ボディ1、プロセス後半⑤~⑨:ボディ2
IELTSライティングTask 1 覚えるべき単語・表現・書き方
IELTSライティングTask 1対策|覚えるべき単語
グラフ・表・地図で使える単語まとめ目次
一つの表現にいろいろな違う単語を覚える必要性
IELTSのWritingに限らず、英語の文章では同じ単語や同じ言い方を繰り返してしまうと単語力と表現力に乏しい単調なつまらない文になってしまう。
文法的にどんなに正しくても、同じ単語(例えば、上がる=increase, 下がる=decrease)を毎回使用していたらスコアはでない。一つの意味でも違う言い方(パラフレイズ)をここで紹介するので徹底的に覚えること。
また、志望動機や大学での論文などを書くときにも繰り返しの単語と表現は絶対に避ける必要がある。(SynonymでGoogle検索をして同意語を用いる)

Meat consumption in the UKの例
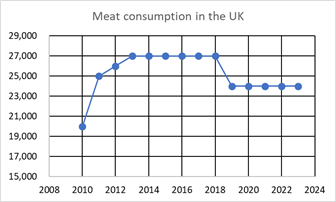
このブラフを表すのに、同じ単語が繰り返されている文 (動詞だけではなく主語も同じ単語が連発されている)
With regards to the domestic consumption of meat in the UK, it was only 20,000 tonnes per year in 2010. It increased significantly to 25,000 tonnes in 2011 before increasing slightly to 26,000 and 27,000 tonnes in 2012 and 2013, respectively. The consumption remained the same at 27,000 between 2014 and 2018, and then the figure decreased to 24,000 tonnes in 2019. After that, the consumption remained the same at 24,000 tonnes until 2023.
英国の食肉の国内消費量は、2010年にはわずか20,000トンだった。2011年には25,000トンと大幅に増加し、2012年には26,000トン、2013年には27,000トンとわずかに増加した。2014年から2018年にかけては27,000トンで横ばいだったが、2019年には24,000トンに減少した。その後、2023年までは24,000トンで横ばいだった。
このブラフを表すのに、同じ単語の繰り返しを避けた文
With regards to the domestic consumption of meat in the UK, it was only 20,000 tonnes per year in 2010, which was the lowest during the recent 13 years. The figure surged to 25,000 in the subsequent year before increasing slightly to 26,000 and 27,000 tonnes in 2012 and 2013, respectively. The quantity of meat eaten domestically in the country plateaued between 2014 and 2018 at 27,000 tonnes, and then the amount dropped to 24,000 tonnes in 2019. After that, the volume levelled off until 2023 at 24,000 tonnes.
英国の食肉の国内消費量は、2010年にはわずか20,000トンで、最近13年間で最も少なかった。 翌年には25,000トンに急増し、2012年には26,000トン、2013年には27,000トンに微増した。 2014年から2018年にかけては27,000トンで頭打ちとなり、2019年には24,000トンに減少した。その後、2023年までは24,000トンで横ばいだった。
IELTSライティングTask 1対策|覚えるべき単語:ダイナミックグラフ・表
上がる/増える
すべての”上がる”がincreaseではスコアは出ず、また同じincreaseでも動詞で使ったり名詞で使ったり、構文を変えて書く必要がある。
動詞 increase/grow/rise/climb/soar(急)/jump(急)
sore/jumpはあるとき急に上がった場合、その他はどれを書いても同じ意味なのでincreaseを1回使ったら、次はgrow、その次はrise、その次はclimbを使うと決めておく。(“go up”はインフォーマルな書き方にも捉えられるのであまりお勧めしない)
人口は1millionから3millionに増えた。
- The population increased to three million from one million.
- The population grew to three million from one million.
- The population rose to three million from one million.
- The population climbed to three million from one million.
- The population soared to three million from one million. (急に増えた)
- The population jumped to three million from one million. (急に増えた)
人口は2million増えた。
- The population increased by two million.
- The population grew by two million.
- The population rose by two million.
- The population climbed by two million.
- The population soared by two million. (急に増えた)
- The population jumped by two million. (急に増えた)
増減を表す動詞には原則として数字を表す名詞が主語になる。人やモノやその他名詞を主語にできないので注意。ただし、population, value, sale, consumption, trafficは増減を表す主語にできる。
○ The population has increased.(populationは数字で表される。priceも同じ)
○ The number of accidents has increased. (数字を表す名詞”number of —“が主語)
✖ Accidents have increased. (Accidentsが主語:ダメ)
名詞 an increase/ a growth/ a rise/ a climb
increase/grow(th)/rise/climbを名詞で使う場合、動詞はsee/undergo/experience/showがそれぞれ使える。
人口は1millionから3millionに増えた。
see + an increase/ a growth/ a rise/ a climb
- The city saw an increase in population from one million to three million.
- The city saw a growth in population from one million to three million.
- The city saw a rise in population from one million to three million.
- The city saw a climb in population from one million to three million.
undergo + an increase/ a growth/ a rise/ a climb
- The city underwent an increase in population from one million to three million.
- The city underwent a growth in population from one million to three million.
- The city underwent a rise in population from one million to three million.
- The city underwent a climb in population from one million to three million.
experience + an increase/ a growth/ a rise/ a climb
- The city experienced an increase in population from one million to three million.
- The city experienced a growth in population from one million to three million.
- The city experienced a rise in population from one million to three million.
- The city experienced a climb in population from one million to three million.
show + an increase/ a growth/ a rise/ a climb (注意:主語はthe cityにならない)
- The graph shows an increase in population of the city from one million to three million.
- The graph shows a growth in population of the city from one million to three million.
- The graph shows a rise in population of the city from one million to three million.
- The graph shows a climb in population of the city from one million to three million.
There is/are構文
人口は1millionから3millionに増えた。
- There was an increase in population from one million to three million in the city.
- There was a growth in population from one million to three million in the city.
- There was a rise in population from one million to three million in the city.
- There was a climb in population from one million to three million in the city.
to, by, ofの使い分けに注意
increaseを動詞で使った場合:increased from 100 to 300 = increased by 200
increaseを名詞で使った場合:an increase from 100 to 300 = an increase of 200
下がる/減る
動詞 decrease/decline/drop/fall/plummet(激減)/slump(激減)
decrease/decline/drop/fallはどれを書いても同じ意味なのでdecreaseを1回使ったら、次はdecline、その次はdrop、その次はfallを使うと決めておく。(“go down”はインフォーマルな書き方にも捉えられるのであまりお勧めしない)
人口は3millionから1millionに減った。
- The population decreased to one million from three million.
- The population declined to one million from three million.
- The population dropped to one million from three million.
- The population fell to one million from three million.
- The population plummeted to one million from three million.
- The population slumped to one million from three million.
人口は2million減った。
- The population decreased by two million.
- The population declined by two million.
- The population dropped by two million.
- The population fell by two million.
- The population plummeted by two million.
- The population slumped by two million.
増減を表す動詞には原則として数字を表す名詞が主語になる。人やモノやその他名詞を主語にできないので注意。ただし、population, value, sale, consumption, trafficは増減を表す主語にできる。
○ The population has decreased.(populationは数字で表される。priceも同じ)
○ The number of accidents has decreased. (数字を表す名詞”number of —“が主語)
✖ Accidents have decreased. (Accidentsが主語:ダメ)
名詞 a decrease/a decline/a drop
decrease/decline/dropを名詞で使う場合、動詞にはsee/undergo/experience/showがそれぞれ使える。
人口は3millionから1millionに減った。
see + a decrease/a decline/a drop
- The city saw a decrease in population from three million to one million.
- The city saw a decline in population from three million to one million.
- The city saw a drop in population from three million to one million.
undergo + a decrease/a decline/a drop
- The city underwent a decrease in population from three million to one million.
- The city underwent a decline in population from three million to one million.
- The city underwent a drop in population from three million to one million.
experience + a decrease/a decline/a drop
- The city experienced a decrease in population from three million to one million.
- The city experienced a decline in population from three million to one million.
- The city experienced a drop in population from three million to one million.
show+ a decrease/a decline/a drop
- The graph shows a decrease in population of the city from three million to one million.
- The graph shows a decline in population of the city from three million to one million.
- The graph shows a drop in population of the city from three million to one million.
There is/are構文
人口は3millionから1millionに減った。
- There was a decrease in population from three million to one million in the city.
- There was a decline in population from three million to one million in the city.
- There was a drop in population from three million to one million in the city.
to, by, ofの使い分けに注意
decreaseを動詞で使った場合:decreased from 300 to 100 = decreased by 200
decreaseを名刺で使った場合:a decrease from 300 to 100 = a decrease of 200
何倍になる
ただ単に100から200に増えた/50に減ったと書くよりも、100から2倍になった/半分になったと書くことで表現方法を増やすことができ得点源になる。
—倍を表す動詞
2倍:double
3倍:triple
4倍:quadruple
5倍:quintuple
2010年から2020年で売上はXX倍になった。
- 2倍:The sales doubled from 2010 to 2020.
- 3倍:The sales tripled from 2010 to 2020.
- 4倍:The sales quadrupled from 2010 to 2020.
- 5倍:The sales quintupled from 2010 to 2020.
10年前と比べてハンバーガーを食べる人の数は3倍になった。
- Compared to a decade ago, the number of people eating hamburgers has tripled (from 5 to 15 million).
—fold : 倍を表す副詞/形容詞
2倍:twofold
3倍:threefold
4倍:fourfold
5倍:fivefold
10倍:tenfold
—foldを副詞で使う場合:動詞はincreaseかriseを使う
2010年から2020年で売上はXX倍になった。
increase(動) + —fold(副)
- 2倍:The sales increased twofold from 2010 to 2020.
- 3倍:The sales increased threefold from 2010 to 2020.
- 4倍:The sales increased fourfold from 2010 to 2020.
- 5倍:The sales increased fivefold from 2010 to 2020.
- 10倍:The sales increased tenfold from 2010 to 2020.
rise(動) + —fold(副)
- 2倍:The sales rose twofold from 2010 to 2020.
- 3倍:The sales rose threefold from 2010 to 2020.
- 4倍:The sales rose fourfold from 2010 to 2020.
- 5倍:The sales rose fivefold from 2010 to 2020.
- 10倍:The sales rose tenfold from 2010 to 2020.
10年前と比べてハンバーガーを食べる人の数は3倍になった。
- Compared to a decade ago, the number of people eating hamburgers has increased threefold (from 5 to 15 million).
—foldを形容詞で使う場合:名詞はincreaseかriseを使う
2010年から2020年で売上はXX倍になった。
—fold(副)+increase(名)
- 2倍:There was a twofold increase in the sales from 2010 to 2020.
- 3倍:There was a threefold increase in the sales from 2010 to 2020.
- 4倍:There was a fourfold increase in the sales from 2010 to 2020.
- 5倍:There was a fivefold increase in the sales from 2010 to 2020.
- 10倍:There was a tenfold increase in the sales from 2010 to 2020.
—fold(副)+rise(名)
- 2倍:There was a twofold rise in the sales from 2010 to 2020.
- 3倍:There was a threefold rise in the sales from 2010 to 2020.
- 4倍:There was a fourfold rise in the sales from 2010 to 2020.
- 5倍:There was a fivefold rise in the sales from 2010 to 2020.
- 10倍:There was a tenfold rise in the sales from 2010 to 2020.
—times(—foldの方が—timesよりもフォーマルな表現)
2倍:two times
3倍:three times
4倍:four times
5倍:five times
10倍:ten times
2020年の売上は2010年のXX倍だった。
- 2倍:The sales in 2020 were two times higher than in 2010.
- 3倍:The sales in 2020 were three times higher than in 2010.
- 4倍:The sales in 2020 were four times higher than in 2010.
- 5倍:The sales in 2020 were five times higher than in 2010.
- 10倍:The sales in 2020 were ten times higher than in 2010.
売上は2000年代にXX倍になった。(“grew”もしくは”increase”と”by—times”を使って表現)
- 2倍:The sales doubled in the 2000s.
- 3倍:The sales grew/increased by three times in the 2000s.
- The sales tripled in the 2000s.
- 4倍:The sales grew/increased by four times in the 2000s.
- The sales quadrupled in the 2000s.
- 5倍:The sales grew/increased by five times in the 2000s.
- The sales quintupled in the 2000s.
- 10倍:The sales grew/increased by ten times in the 2000s.
フィッシュアンドチップスを食べる人の数はピザを食べる人の数の3倍いる。
- The number of people eating fish and chips was three times as many as people eating pizzas.
何分の1になる
—分の1(1/2)になるという表現を使うことで、ただ100から50に減ったというよりも、100と50の比較ができるので高得点に繋がる。
X分のYを表す表現 (X/Y:Xは数字でYは 序数 → Xが1以外なら序数にsがつく)
1/2: half
1/3: one third
1/4: quarter
2/5: two fifths
3/4: three quarters
5/7: five sevenths
The sales declined from £3000 per month to nearly one third that figure.(売上げは£3000から1/3(£1000)に減った)
= The sales declined by two thirds from £3000.
The number of annual visitors decreased from 1 million to a quarter of that number. (訪問者は100万人から1/4(25万人)に減った)
= The number of annual visitors decreased by three quarters from 1 million. (3/4減った)
“to”は最終的な値、“by”は変化量(差)を表す。つまり、1/3”に”減る(decline to nearly one third:最終的にもとの1/3になる)は2/3減る(decline by two thirds:もとの2/3の分減る)ということ。
半分になる:Halve
The sales halved during the decade.(売上げは10年で半分になった)
追い越す/追い抜く
項目を比較する場合に、AがBを追い越した、BはAに追い越されたは必ず文に入れると得点につながる。
何か(名詞)が何か(名詞)を追い越す(目的語は名詞):overtake
London overtook Tokyo in terms of population density in 2020.
ロンドンは2020年に人口密度で東京を追い抜いた。
数が一定値を追い越す(目的語は数字):exceed
The population of London exceeded 10 million in 2020.
ロンドンの人口は2020年に1000万人を超えた。
名詞/数どちらの場合でも使用可能(目的語は名詞も数字も可能):surpass
London surpassed Tokyo in terms of population density in 2020.
ロンドンは2020年に人口密度で東京を追い抜いた。
The population of London surpassed 10 million in 2020.
ロンドンの人口は2020年に1000万人を超えた。
頂点/最高値に達する
増えたということだけではなく最終的にどうなったのか、どのポイントが最大だったのかを書くことで、文からグラフを想像しやすくなる。
peak (at) (peak: 動詞)
The sales peaked at three million USD in 2023.
売上高のピークは2023年の300万ドルだった。
reach a peak (of) (peak: 名詞)
The sales reached a peak of three million USD in 2023.
売上高は2023年に300万 USDのピークに達しました。
注)peakを動詞で使う場合:peak at、peakを名詞で使う場合:a peak of
reach the highest figure/point (of)
The sales reached the highest point of three million USD in 2023.
売上高は2023年に300万 USDの最高値に達しました。
最低値に達する
減ったということだけではなく最終的にどうなったのか、どのポイントが最低値だったのかを書くことで、文からグラフを想像しやすくなる。
reach the lowest figure/point
The sales reached the lowest figure of three million USD in 2023.
売上高は2023年に300万 USDの最低の数字に達しました。
The sales reached the lowest point of three million USD in 2023.
売上高は2023年に300万 USDの最低値に達しました。
fall to the lowest figure/point
The sales fell to the lowest figure of three million USD in 2023.
売上高は2023年に300万 USDの最低の数字に低下しました。
The sales fell to the lowest point of three million USD in 2023.
売上高は2023年に300万 USDの最低値に低下しました。
hit a low of
The sales hit a low of three million USD in 2023.
売上高は2023年に300万ドルの低水準に達した。
* hit rock bottom(最低値に達する)は口語表現なのでWriting Task1では使わない
変わらない/一定

上った、下がった以外にも”変わらない”、”変化がなくなった”は必ず覚えておく。変化がないも重要な特徴である。
plateau
The population in the city plateaued at 3 million from 1990 to 2000.
市の人口は1990年から2000年にかけて300万で一定になった。
(plateauを動詞で使う場合:plateau at、 plateauを名詞で使う場合:(reached) a plateau of)
stay / stay unchanged / remain unchanged / remain stable
The revenue stayed about the same at around £30,000.
収益は30,000ポンドくらいでほぼ同じだった。
The population in the city stayed unchanged at 3 million from 1990 to 2000.
市の人口は1990年から2000年にかけて300万で横ばいだった。
The population in the city remained unchanged at 3 million from 1990 to 2000.
市の人口は1990年から2000年にかけて300万で横ばいだった。
The population in the city remained stable at 3 million from 1990 to 2000.
市の人口は1990年から2000年にかけて300万で横ばいだった。
remain high/low/constant
The sales remained high over the decade.
売上は10年間高い状態を維持した。
The sales remained low over the decade.
売上は10年間低い状態を維持した。
The sales remained constant over the decade.
売上は10年間同じ状態を維持した。
hover (微動)
The number of burglaries hovered at around 4000 from 1999 to 2002.
空き巣の件数は1999年から2002年にかけて4000件前後で推移していた。
”変動がなかった”と直接的にいうのもアリ!
The sales did not experience any significant changes over the decade.
10年を通して売上高には大きな変動はなかった。
(変化の後)ある一定で落ち着く

stabilise/stagnate
The population increased by 0.1 million from 2000 to 2010 and stabilised at 10 million after that.
人口は2000年から2010年にかけて10万人増加し、その後は1000万で安定しました。
The population increased by 0.1 million from 2000 to 2010 and stagnated at 10 million after that.
人口は2000年から2010年にかけて10万人増加し、その後は1000万で停滞しました。
level off
The population increased by 0.1 million from 2000 to 2010 and levelled off at 10 million after that.
人口は2000年から2010年にかけて10万人増加し、その後は1000万で横ばいになりました。
reach a plateau
The population increased by 0.1 million from 2000 to 2010 and then reached a plateau of 10 million.
人口は2000年から2010年にかけて10万人増加し、その後1000万で頭打ちになりました。
変動する
特に小刻みに上下している場合のグラフなどに使える。その小刻みをひとつひとつ説明する必要はなく、変動の一言で表せればよい。
動詞:fluctuate
Population figures fluctuated between one million and two million from 2010 to 2020.
人口は2010年から2020年にかけて100万人と200万人の間で増減しました。
名詞:fluctuation
The two bar graphs illustrate fluctuations in Japanese population numbers.
2つの棒グラフは日本の人口変動を示している。
There were fluctuations in population numbers of between one million and two million.
100万年から200万年にかけて人口変動があった。
”どんな風に”
形容詞や副詞を使ってどのように増えたのか/減ったのかを必ず書く。Writing Task1で大切なのは、読み手が文からグラフ/表を想像できること。形容詞や副詞はその想像を助ける単語で、得点に繋がりやすい。
少しだけ(量)
slight(形) – slightly(副)
marginal(形) – marginally(副)
moderate(形) – moderately(副)
The population increased slightly from 100 million to 101 million during the decade.
人口は1億人から1億100万人に微増した。
The city experienced a slight increase in population from 100 million to 101 million during the decade.
人口は1億人から1億100万人に微増した。
大幅に(量)
significant(形) – significantly(副)
considerable(形) – considerably(副)
dramatic(形) – dramatically(副)
substantial(形) – substantially(副)
drastic(形) – drastically(副)
The population increased significantly from 100 million to 300 million during the decade.
人口は1億人から3億人に大きく増大した。
The city experienced a significant increase in population from 100 million to 101 million during the decade.
人口は1億人から1億100万人に大きく増大した。
急に(速度)
sharp(形) – sharply(副)
sudden(形) – suddenly(副)
rapid(形) – rapidly(副)
steep(形) – steeply(副)
The population increased steeply from 100 million to 150 million during the past decade.
人口は1億人から1億5千万人に急増した。
The city experienced a steep increase in population from 100 million to 150 million during the past decade.
人口は1億人から1億5千万人に急増した。
だんだんと(速度)
stead(形) – steadily(副)
gradual(形) – gradually(副)
slow(形) – slowly(副)
incremental(形) – incrementally(副)
marginal(形) – marginally(副)
The population has increased gradually from 100 million to 150 million during the past five decades. (during the past five decades: 今から過去50年間なので現在完了形を使用)
人口は1億人から1億5千万人にだんだんと増加した。
The city has experienced a gradual increase in population from 100 million to 150 million during the past five decades.
人口は1億人から1億5千万人にだんだんと増加した。
継続的に
continuous(形) – continuously(副)
steady(形) – steadily(副)
constant(形) – constantly(副)
year by year/day by day
The population has increased continuously from 100 million to 150 million during the past five decades. (during the past five decades: 今から過去50年間なので現在完了形を使用)
人口は1億人から1億5千万人に継続的に増加した。
The city has experienced a continuous increase in population from 100 million to 150 million during the past five decades.
人口は1億人から1億5千万人に継続的に増加した。
期間の表し方
期間もワンパターンで毎回上がった期間from— to —、下がった期間from— to —ではなく、色々な表現を使て書くこと。
from — to —
The sales increased from 2010 to 2015.
売上高は2010年から2015年に増加した。
from — onwards (—年以降)
The sales increased from 2010 onwards.
売上高は2010年以降増加しました。
“from 2010″だけでも文法的には正しいが、”onwards”を入れると以降ずっとその状態が続いている意味になる。
between — and —
The sales increased between 2010 and 2015.
売上高は2010年から2015年の間に増加しました。
throughout (the period)
The sales increased throughout the period surveyed.
売上高は調査期間全体で増加しました。
during
The sales increased during the five years.
売上高は5年間で増加しました。
The sales increased during the period from 2010 to 2015. The sales increased during the five-year period.
売上高は2010年から2015年の期間で増加しました。売上高は五年間で増加しました。
over
The sales increased over the five years.
売上高は五年間で増加しました。
The sales increased over the period from 2010 to 2015. = The sales increased over the five-year period.
売上高は2010年から2015年の期間で増加しました。=売上高は5年間で増加しました。
からの(続く)—年間
「2010年から2015年まで売り上げは下がったが、2015年からの5年間は売り上げは上がった」のように連続する期間を表すのにsubsequent/subsequently, followingで表す。
subsequent/subsequently
The sales declined from 2010 to 2015, but they grew for the subsequent five years.
売上高は2010年から2015年に減少しましたが、その後の5年間は増加しました。
following
Following the decline from 2010 to 2015, the sales grew for/over the next five years.
売上高は2010年から2015年に減少しましたが、その後の5年間は増加しました。
= The sales declined from 2010 to 2015, but they grew for the next five years.
IELTSライティングTask 1対策|覚えるべき単語:スタティックグラフ・表
スタティックグラフ/表では、ダイナミックの変化の表現とは異なり、状態を表す表現を使う必要がある。また、ダイナミックと同じようにワンパターンの表現ではなく、色々な言い方で書くことでスコアにつなげる。
“—(数字)である”を表す動詞・前置詞
is/are
73% of the population in Sydney are native Australians.
シドニーの人口の73%はオーストラリア先住民です。
The proportion of native Australians in Sydney is 73% of the population.
シドニーのオーストラリア先住民の割合は人口の73%を占める。
at
There was a very low percentage of old people who took part in any computer-based activities, at 5%.
コンピューターを使った活動に参加している高齢者の割合は5%と非常に低かった。
Over half of the water that was used in residential areas was consumed in bathrooms and gardens, at 29% and 27%, respectively.
住宅地で使用されている水の半分以上が浴室と庭で消費されており、それぞれ29%(浴室)と27%(庭)だった。
stand at (stands at + 数値)
The proportion of native Australians in Sydney stands at 73% of the population.
シドニーのオーストラリア先住民の割合は人口の73%である。
account for (account for 数値 / account for 説明 at 数値)
account for 数値
The proportion of native Australians in Sydney accounted for 73%.
シドニーのオーストラリア先住民の割合は73%である。
account for 説明 at 数値
The proportion of native Australians in Sydney accounted for the largest section of the population at 73%.
シドニーのオーストラリア先住民の割合は73%で、人口の中で最大の割合を占めている。
represent (represent 数値 / represent 説明 at 数値)
represent 数値
The proportion of native Australians in Sydney represents 73%.
シドニーにおけるオーストラリア先住民の割合は73%です。
The vast majority of the population in Sydney is represented by native Australians at 73%.
シドニーの人口の大多数を占めるオーストラリア先住民は73%です。
represent 説明 at 数値
The proportion of native Australians in Sydney represents the vast majority at 73% of the population.
シドニーにおけるオーストラリア先住民の割合は、人口の73%と大多数を占めています。
take share (at)
Native Australians in Sydney take the largest share of the population at 73%.
シドニーのオーストラリア先住民は、人口の73%と最大の割合を占めています。
with with+名詞 でその名詞に数字を含める
The youngest age group finds making friends the easiest, with a proportion of only 10%.
最も若い年齢層は、友達を作るのが最も簡単で、(困難だと感じる人の)割合はわずか10%です。
Toilets and kitchens consumed a lower amount of water compared to bathrooms, with 15% and 10% of the total residential water usage, respectively.
トイレとキッチンは、浴室と比べて水の消費量が少なく、それぞれ住宅全体の水使用量の15%(トイレ)と10%(キッチン)を占めています。
—%を占める
一つの数値で全体の何%を占めると書く場合でも、ある数値とある数値を合計して何%を占めると書く場合でも使える。合計値を書くことも大きな特徴を書くことにつながる。
make up
The sales of meat and fish made up 70%, with the former and the latter standing at 57% and 13%, respectively. (former: meat / latter: fish)
内訳は、肉が57%、魚が13%で、あわせて70%を占めている。
The pie chart indicates that 90% of the population in Japan is made up of Japanese people themselves.
円グラフを見ると、日本の人口の90%が日本人であることがわかる。
The water consumption in residences, namely apartments and houses, made up a 70% share of the total, with apartments and houses standing at 57% and 13%.
水の使用量は、住居つまりアパートと一軒家で合計70%を占め、アパートで57%、一軒家で13%を占めている。
account for
The sales of meat and fish accounted for 70%, with the former and the latter standing at 57% and 13%, respectively. (former: meat / latter: fish)
内訳は、肉が57%、魚が13%で合計70%を占めている。
Meat sales accounted for the largest share of total supermarket sales at 40%.
スーパーの売上高に占める割合は、肉が40%と最も多い。
comprise
The sales of meat and fish comprised 70%, with the former and the latter standing at 57% and 13%, respectively. (former: meat / latter: fish)
内訳は、肉が57%、魚が13%で合計で全体の70%を占めた。
constitute
The sales of meat and fish constituted 70%, with the former and the latter standing at 57% and 13%, respectively. (former: meat / latter: fish)
内訳は、肉が57%、魚が13%と全体の70%を占めた。
パーセントの表し方
直接数字を書くのではなくパーセントもパラフレイズして書くことでスコアにつなげる。
20%:one fifth
25%:quarter
50%:half
66%:two-thirds
75%:three quarters
47%~49%:slightly under/just below/just under a half
51%~53%:slightly over/just above/just over a half
47%~53%:around a half
73% を「75%を少し下回る程度」として表現する場合
The pie chart indicates that just under three quarters of the residents in London are people from the UK.
円グラフを見ると、ロンドンの住民の3/4(75%)弱がイギリス人であることがわかる。
25%と20%を表現する場合
This bookshop sold relatively equal proportions of each type of genre with History making up one quarter, followed by Adult Fiction, Children’s Fiction, and Biographies all at one fifth, and travel was the lowest at 15%.
(売った本のジャンル:history=25%(a quarter), adult fiction, children’s fiction, biography=各20%(all at one fifth), travel=15%)
この書店では、各ジャンルの売り上げの割合は比較的同じで、歴史が1/4(25%)、アダルト・フィクション、児童小説、伝記がそれぞれ1/5(20%)と続き、旅行が15%と最も低かった。
パーセントと割合の使い方
パーセントと割合(そのパーセントに対する割合)を積極的に比較に使うことで、ただ数字を書くだけではなく数字同士の比較をする。
パーセントのみで書いた文
The proportion of young people participating in the lesson accounted for 60%, whereas that of middle-aged people and senior people stood at 30% and 10%, respectively.
そのレッスンの参加者は若者が60%で、一方で中高年が30%、高齢者が10%だった。
パーセントとその割合を使って書いた文
The proportion of young people participating in the lesson accounted for 60%, whereas that of middle-aged and senior people stood at half and one sixth of that figure, respectively.
(young peopleは全参加者の60%、middle-aged peopleは(60%の)半分(30%)、senior peopleは(60%の)1/6(10%))
そのレッスンの参加者は若者が60%で、一方で中高年がその半分(30%)、高齢者がその1/6(10%)だった。
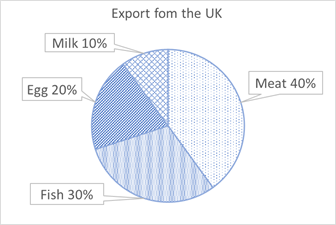
The proportion of meat accounted for the largest share of exports from the UK at 40%, followed by fish at just under a third. The share of egg exports stood at half the figure of meat at one fifth. Milk represented the smallest percentage among the four categories at 10%.
(“Egg(20%)はMeat(40%)の半分”とEggのパーセントをベースにMeatの割合を記載)
英国からの輸出に占める割合は肉類が40%と最も多く、次いで魚類が1/3(33%)弱だった。卵は肉類の半分で1/5(20%)のだった。牛乳は10%で最も少なかった。
”なん対なん”の割合
ratio (to)(全体100%の内のそれぞれの割合)
The ratio of men to women was 6.5 to 3.5.
男女比は6.5対3.5。
The ratio of their preference for full fat butter to low fat is 60% to 40% for the youngest group, while this ratio is almost equal for the oldest group.
全脂肪バターと低脂肪バターの比率は、若年層では60%対40%、一方高齢層ではほぼ同じ(50%対50%)である。
ratio(比率)は100%の内のそれぞれの割合(男女比6:4など)で使われるので、percentageやproportionの同意語としては使えない。X%を表す場合には、percentage, proportion, shareを使って、ratioは使う前に適切か考えること。また、rate(率)も同じで、%を表さない場合が多い。mortality rate(死亡率)やexchange rate(為替レート)などで使われ、dollar’s exchange rate against the yen(ドルの円に対する為替レート)などとして使われる。
IELTSライティングTask 1対策|覚えるべき単語:ダイナミック・スタティック共通
だいたいの数の表し方
ぴったりな数字以外には必ず、その数字を表現するのに少し上回るや下回るという表現をいれてだいたいの数字を書く。無理に数字を目盛りから読む必要はない。また、ここでもすべての数字をabout—で書くのではなく、色々な表現を使って書くこと。
少し上回る:just above / just over / slightly over
The figure represented just above 10 million.
The figure represented just over 10 million.
The figure represented slightly over 10 million.
数値は1000万を少し上回った。
少し下回る:just below/just under/slightly under/nearly
The figure represented just below 20 million.
The figure represented just under 20 million.
The figure represented slightly under 20 million.
The figure represented nearly 20 million.
数値は2000万を少し下回った。
注)nearlyにそれより上は含まれない:nearly 20は17くらい~19.9 (20未満)
だいたい:almost/around/approximately/roughly/about
The figure represented almost 33 million.
The figure represented around 33 million.
The figure represented approximately 33 million.
The figure represented roughly 33 million.
The figure represented about 33 million.
数字はだいたい3300万だった。
注)more than / less than / above / over / below / under はそれ以上/以下すべてが含まれるので使い方注意。「ちょい下まで/ちょい上まで」はjust belowやjust aboveで書けるが、「1000ちょい下まで下がった」をdecreased to less than 1000と言ってしまうと0~999まですべて含まれてしまう。必ず、”だいたい”を表現する言葉を適切に入れる。
数字の表し方
”—の数”の言い方
可算名詞:number
The number of visitors/tourists to London increased by 10,000 from 2000 to 2010.
ロンドンへの訪問者/観光客の数は、2000年から2010年にかけて1万人増加した。
The visitor/tourist numbers to London increased by 10,000 from 2000 to 2010.
ロンドンへの訪問者/観光客の数は、2000年から2010年にかけて1万人増加した。
不加算名詞:amount (単位関係なし), volume (主にm3)
The amount of plastic garbage declined by 10,000 tonnes from 2000 to 2010.
プラスチックごみの量は、2000年から2010年にかけて1万トン減少した。
The volume of plastic garbage declined by 10,000 cubic metres from 2000 to 2010.
プラスチックごみの量は、2000年から2010年にかけて1万立方メートル減少した。
不加算名詞:quantity
The quantity of sugar consumed in the UK rose by 10% from 2000 to 2010.
英国の砂糖消費量は2000年から2010年にかけて10%増加した。
”その数字”の言い方
数字:figure
Meat sales rose by 10% between 2000 and 2010. The figure rose by a further 5% in the subsequent two years.
食肉の売上高は2000年から2010年の間に10%増加した。その後の2年間でさらに5%増加した。
Meat sales in 2000 reached/hit £20,000. This sales figure was the highest achieved during the decade.
2000年の食肉の売上高は2万ポンドに達した。この売上高は、この10年間で達成された最高の数字であった。
“figure”はすべての数字(数、パーセント、量 etc)に使えるが、”—の値”とする場合には”figure for”、特定の数値を指す場合には”figure of”になる。
- the figure for advertising costs
- the average figure of 30,000
参考書のサンプルによっては、”volume”や”size”、”level”を名詞につけて—の量を表す場合もある。パラフレイズの一つとして覚えておくと良いが、すべての単語にこれらをつけてしまうとクドい英語になってしまうので注意。
production volume (生産量) = amount of production
population size (人口) = populationだけでも人口の意味は伝わる
consumption level (消費量) = amount of consumption / consumptionだけでも消費量の意味は伝わる
また、数字に”mark”や”points”をつけている参考書もあるが、これらは必ずしもつける必要はない。
50% = 50 percent = 50 percentage points
(人口) 1億人 = 100 million = the 100 million mark (markをつける場合には冠詞のtheをつける)
”それぞれ”の表し方
数値はまとめて書いて、”それぞれ”を表す”respectively”で何がどの数値かを記す。
The proportion of citizens that immigrated from New Zealand and China stands at 20% and 10%, respectively.
ニュージーランドと中国からの移民の割合は、それぞれ20%(=ニュージーランド)と10%(=中国)である。
The consumption of milk by age group of 18-25, 26-65, and 65+ is 1,600ml, 1,700ml, and 1,900ml, respectively.
牛乳の消費量は、年齢別では18-25歳が1,600ml、26-65歳が1,700ml、65歳以上が1,900mlである。
The value of imports and exports dropped by 20% and 10%, respectively, during the decade.
10年間で輸入額は20%、輸出額は10%減少した。
前者(former)と後者 (latter)
formerとlatterで書くことで、繰り返し同じ単語を使うことを避けることができる。
Young people preferred to be involved in playing sports and dancing with just over one-third and nearly one-third of them doing the former and the latter, respectively.
(former = playing sports, latter = dancing)
若者はスポーツやダンスをすることを好み、1/3強が前者(スポーツ)をし、1/3弱が後者(ダンス)をした。
IELTSライティングTask 1対策|覚えるべき単語:地図
場所にある状態
There is/are
There is a laboratory on the east side of the campus.
キャンパスの東側に研究室がある。
Thera are some computers in the corner of the library.
図書館の隅にコンピュータがある。
There is a road running from east to west.
東西に走る道路がある。
There are trees along the road.
道路沿いに木がある。
There is a cycle path running through the park.
公園の中を走る自転車道がある。
There was a park with trees and grass and a car park.
木と草のある公園と駐車場があった。
have/has
The university has an outdoor pool and two tennis courts on the right side of the map.
大学には、マップの右側に屋外プールと2つのテニスコートがあります。
The library had a reception next to the entrance.
図書館には、入り口の横に受付がありました。
be located
The laboratory is located on the east side of the campus.
研究室はキャンパスの東側にあります。
Five houses are located along the river.
川沿いに5軒の家があります。
The computers are located in the library.
コンピュータは図書館にあります。
The library is located next to the school.
図書館は学校の隣にある。
lie
The forest lies across the river.
森は川の向こう側にあります。
The monument lay in the centre of the campus. (lie-lay-lain) (past)
記念碑はキャンパスの中心にありました。
be situated
Some houses are situated on the hill.
いくつかの家が丘の上にあります。
One restaurant is situated on the west side of the map.
地図の西側に1軒のレストランがあります。
sit
The building sits on the main street.
建物は大通りに面しています。
There is a building sitting on the main street.
大通りに建物があります。
be positioned
A computer and a printer are positioned on the right side of the library.
コンピュータとプリンタは、図書館の右側にあります。
A kiosk is positioned in the centre of the platform.
キオスクは、プラットフォームの中央にあります。
face
The house faces north.
その家は北向きです。
場所にある状態(道、川)
run:(道, 川が)走る
The river runs on the northside of the town.
川は町の北側を流れています。
There are additional cycle routes running through the centre of the park.
公園の中心を通る新しいサイクルルートがあります。
lead to:通じる
The footpath leads to the library.
歩道は図書館につながっています。
The main street leads to the station.
大通りは駅に向かっている。
head:向かう
The main street heads to the station.
大通りは駅に向かっている。
connect:結ぶ
The railway connects the east and west of the town. (connect A and B)
鉄道は町の東西を結んでいます。
The new cycling path connects the school with the library. (connect A with B)
新しいサイクリングロードは図書館と学校を結びます。
Some footpaths connect the different laboratories within the university. (connect 複数のもの)
いくつかの歩道が大学院の研究室を結んでいます。
extend:延びる
The railway line extends from the west to the east.
鉄道が西から東に走っている。
stretch:伸びる
The island stretches from north to south. (通常stretchは北―南、東―西に延びるときに使う。北―東などは使わない)
島は南北に広がっています。
divide:分断する
The main road divides the town into two parts.
大通りは街を2つに分断している。
diverge:分岐する
The main road diverges into two separate roads. (diverge into)
メイン通りは2つの道に分かれる。
A small road diverges from the main road. (diverge from)
小さな道はメイン通りから分かれる。
変わる・変化する
undergo
The library underwent a conversion.
図書館は改装されました。
The museum underwent renovation.
博物館は改装されました。
see changes / see a change in
The town saw changes in the location of its facilities.
町では、施設の場所が変更されました。
The library saw changes in the arrangement of books.
図書館では、本の配置が変更されました。
alter (changed partly)
The coastal area was altered from a public beach into a private swimming facility, which is exclusively for residents.
その沿岸のエリアは公共のビーチから住民専用のスイミング施設に変わりました。
renovate
The museum is scheduled to be renovated to include a new step-free access toilet.
博物館は、新しい段差のないトイレを設置するために改修される予定である。
変わる・違う用途になる
change into
The library was changed into a museum.
図書館が博物館に変更されました。
The car park was changed into a tennis court.
駐車場がテニスコートに変更されました。
be replaced with / replace
The library was replaced with a museum.
図書館が博物館に変更されました。
A museum replaced the library.
図書館に代わり博物館ができました。
The park and the car park were replaced with a basketball court and tennis courts, respectively.
(park ⇒ basketball court / car park ⇒ tennis courts)
= A basketball court and tennis courts replaced the park and the car park, respectively.
公園と駐車場は、それぞれバスケットボールコートとテニスコートに変わりました。
be transformed into
The cube-like building will be transformed into a columnar museum.
立方体のような建物は、円柱状の博物館に変わる予定です。
The IT centre has been transformed into an innovation centre.
ITセンターは、イノベーションセンターに変わりました。
turn into
The outdoor facility has been turned into an indoor area that contains the swimming pool, the café and the reception. (outdoor facility, swimming pool, café, receptionはもとからあったのでこれらには”the”, それらがインドアになったのでそのindoor areaにはa(an)をつけた)
屋外施設は、プール、カフェ、受付を含む屋内エリアに変わりました。
be converted into
The library will be converted into a museum.
図書館は博物館に変わる予定です。
The old houses will be converted into hotels.
古民家はホテルに変わる予定です。
become
The existing rectangular shaped area with eight gates will be modified to become a Y-shaped corridor with 18 gates.
(空港)既存の8つのゲートがある長方形のエリアは、18のゲートがあるY字形の通路に変わる。
変わる・場所が変わる
be relocated to
The library, which was on the north side, was relocated to the east side.
北側にあった図書館は東側に移転された。
The museum was relocated to the edge of the town.
博物館は町の端に移転された。
move to
The existing check-in counter will be moved to the opposite side of the airport.
既存のチェックインカウンターを空港の反対側に移動される予定です。
The computers will be moved from the left to right side of the laboratory.
コンピュータは研究室の左から右に移動される予定です。
変わる・開発される
be developed into
The village will be developed into a small town with a university.
村は大学のある小さな町に発展する。
The island has been developed into a tourist resort with hotels and restaurants.
島はホテルやレストランのある観光リゾートに開発された。
grow into
The small town grew into a big city with a hospital and a university.
小さな町は病院と大学のある大都市に成長しました。
The small hotel grew into a large facility with a swimming pool and a spa.
小さなホテルはプールとスパのある大きな施設に成長しました。
変わる・近代化する
be modernised
The library was modernised with wheelchair friendly toilets and step-free access.
図書館は車椅子に優しいトイレと段差のないアクセスで近代化されました。
The museum was modernised with many contemporary pieces of art.
美術館は多くの現代美術作品で近代化されました。
Redevelop (into)
The small suburban village has flourished and been redeveloped into a large town with public facilities.
郊外の小さな村は繁栄して公共施設のある大きな街になりました。
Urbanise
The small suburban village has been urbanised due to the ongoing development.
郊外の小さな村は開発により都市化しました。
Industrialise
The small suburban village has been industrialised with many factories built in recent years.
郊外の小さな村は開発により多くの工場を有するように産業化しました。
変わる・加わる
be added
A new laboratory was added.
新しい研究室が追加されました。
A printer was added next to the computer.
コンピューターの横にプリンターが追加されました。
be placed
A new big screen and ATM will be placed in front of the restaurant.
レストランの前に新しい大きなスクリーンとATMが設置されます。
be make
The basketball court was made by removing the greenery in the park.
バスケットボールコートは、公園の緑を取り除いて作られました。
変わる・建物が建てられる
be added
A new laboratory was added next to the car park.
駐車場の隣に新しい研究所が追加されました。
Some new facilities have been added by eliminating some greenery.
緑を取り除いていくつかの新しい施設が追加されました。
Some facilities are expected to be added by cutting trees down and relocating roads.
木の伐採や道路を移転することによって、いくつかの施設が追加される予定です。
be constructed / built
A new laboratory was constructed next to the car park.
駐車場の隣に新しい研究所が建設されました。
A new university was built on the east side of the town.
町の東側に新しい大学が建設されました。
new — (lie)
A new footpath will lie alongside the road.
新しい歩道が道路沿いに整備されます。
変わる・道路が作られる
be built
A new road, which connects a library and a university, will be built.
図書館と大学を結ぶ新しい道路が建設される予定です。
be laid
New paths, which connect the station with the innovation centre, have been laid.
駅とイノベーションセンターを結ぶ新しい道路が敷設されました。
be introduced
New cycle paths have been introduced alongside the roads.
道路沿いに新しいサイクルパスが導入されました。
be made
A new road will be made to connect the library and the city hall.
図書館と市役所を結ぶ新しい道路が作られる予定です。
new—(run)
A new road will run from south to north.
新しい道路が南から北に走る予定です。
create
A cycling road was created along the river.
サイクリングロードが川に沿って作られた。
変わる・サイズ、数
サイズ大きくなる/小さくなる: increase/decrease in size
The playground increased in size.
運動場が大きくなりました。
The playground decreased in size.
運動場が小さくなりました。
規模が大きくなる/小さくなる: enlarged/reduced
The tennis court was enlarged.
テニスコートが大きくなりました。
The tennis court was reduced.
テニスコートが小さくなりました。
範囲が大きくなる:expand, enlarge
The university will expand to include more areas for research, education and improved accessibility.
大学は、研究、教育、より良いアクセスのためのエリアを含むように拡張される予定です。
The library has been enlarged, overtaking the green space.
図書館は、緑地を伐採して拡大されました。
The tennis court was enlarged.
テニスコートは拡大された。
数が増える:increase/decrease in number
The tennis courts increased in number.
テニスコートの数が増えました。
The tennis courts decreased in number.
テニスコートの数が減りました。
The school saw an increase in the number of classrooms.
学校では教室の数が増えました。
幅が広くなる・狭くなる:widen/narrow
距離が延長される・短くなる:extend/shorten
無くなる
be remove
The greenery in the park was removed and the basketball court was made.
公園の緑が取り除かれ、バスケットボールコートが作られました。
The basketball court was made by removing the greenery in the park.
バスケットボールコートは公園の緑を取り除いて作られました。
demolish
The school was demolished.
学校は取り壊された。
no longer (there)
The old harbour, where several boats were docked, no longer exists due to the construction of the hotel.
ホテルの建設によりいくつかのボートが停泊していた船着き場はもうそこにはない。
“not any longer”は口語表現(informalな表現)なのでIELTS Writingでは使わない。
変わらない
remain unchanged/be unchanged
The location of the laboratories and the walkway will remain unchanged.
研究室と歩道の位置は変更されない予定です。
The location of library will be unchanged.
図書館の位置は変更されない予定です。
remain the same
In the library, the location of the reception and the computers remained the same.
図書館では、受付とコンピューターの位置は変わりませんでした。
stay the same
The existing walkway and the library will stay the same.
既存の歩道と図書館は変わらない予定です。
場所を表す前置詞
東西南北
The restaurant is on the east/west/south/north of the café.
レストランはカフェの東/西/南/北にあります。
A centre for research and development has been built on the north-west side of the park on the grassland.
研究開発センターは公園の北西側の草地に建てられています。
The northern half has the restaurant in the east, but the rest of the area is occupied by trees. The southern half is further divided into two halves by the walkway.
北側の半分は東にレストランがありますが、残りの部分は木で占められています。南側の半分は歩道でさらに2分割されています。(北半分の東側(地図の右上側)にはレストランがあり残りの部分(地図の左上側)は木々が植えられている。南半分はwalkwayで2つに区切られている)
ただ”東にある”と書く場合には”in the east”、”—の東にある”と書く場合には”on the east of—“になるので注意。
in the east/west/south/north: 位置
on the east/west/south/north of—: 位置関係
地図の右側・左側
In 1980, on the left/right side of the map, there was a park with trees.
1980年、地図の左/右側には木々が生い茂る公園があった。
The left/right side of the facilities has been turned into an indoor area.
施設の左/右は屋内エリアになっている。
隣(隣どうし)・近く:next to, side by side, adjacent, adjacent to, vicinity(近く)
Next to the swimming pool, the café, the reception and the changing rooms were located side by side.
プールの隣にはカフェ、受付、更衣室が並んでいた。
The reception area has also been changed to a university hub, while the adjacent offices remain the same.
受付エリアも大学のハブに変更されたが、隣接するオフィスに変更はなかった。
The school is adjacent to the city library.
学校は市立図書館に隣接している。
A new library will be built in the vicinity of the main hall.
新しい図書館がメインホールに近くに建てられる。
—にそって:along
A station has been constructed on the existing railway running along the southern part of the park.
公園の南側を走る既存の鉄道に駅が建設された。
―の向かい側:across from
The museum was across from the art gallery.
アートギャラリーはミュージアムの向かいにありました。
―の前に:in front of
The museum was in front of the art school.
芸術学校の前にミュージアムがありました。
―の後ろに:behind
The library was behind the art school.
芸術学校の後ろに図書館がありました。
―の反対側/向かい側に:opposite
There was a bus stop opposite the hotel.
ホテルの向かい側にバス停がありました。
The museum was opposite the hotel.
美術館はホテルの反対側にありました。
The museum was located on the opposite side of the street.
美術館は通りの向かい側にありました。(opposite:形容詞)
IELTSライティングTask 1対策|使える表現・書き方
ここではこれまでに説明した”覚えるべき単語”を組み合わせて、どのような表現で書けば高得点につながるかをここでご説明します。
IELTSライティングTask 1対策|ダイナミックグラフ・表で使える表現・書き方
上って下がる・下がって上がるの表現方法
「上がって下がる」や「下がって上がる」は、”After that / — after which で時系列に表現”、”前置詞beforeを使って表現”、”付帯状況のwithを使って表現”、”関係代名詞を使って状況を説明”の4つの表現方法を覚え、違う表現方法でパラフレイズしながら書く。
サッカーチケットの値段の変化

JAPAN:上がって下がる / UK:下がって上がる
After that / — after which で時系列に表現
上って下がる
JAPAN:10ドル(2000年)→ 40ドル(2010年)→ 20ドル(2020年)
In Japan, the price of a football ticket increased from 10 dollars in 2000 to 40 dollars in 2010. After that, the price dropped to 20 dollars in 2020.
日本では、サッカーのチケットの価格が2000年の10ドルから2010年には40ドルに上昇した。 その後、2020年には20ドルまで下がりました。
In Japan, the price of a football ticket increased from 10 dollars in 2000 to 40 dollars in 2010, after which the price dropped to 20 dollars in 2020.
日本では、サッカーチケットの価格は2000年の10ドルから2010年には40ドルに上昇し、その後、2020年には20ドルまで下がりました。
下がって上がる
UK:50ドル(2000年)→ 20ドル(2010年)→ 40ドル(2020年)
In the UK, the price of a football ticket decreased from 50 dollars in 2000 to 20 dollars in 2010. After that, the price rose to 40 dollars in 2020.
イギリスでは、サッカーチケットの価格は2000年の50ドルから2010年には20ドルに下がりました。 その後、2020年には40ドルまで上がりました。
In the UK, the price of a football ticket decreased from 50 dollars in 2000 to 20 dollars in 2010, after which the price rose to 40 dollars in 2020.
イギリスでは、サッカーチケットの価格は2000年の50ドルから2010年には20ドルに下がり、その後、2020年には40ドルまで上がりました。
前置詞beforeを使って表現
上って下がる
JAPAN:10ドル(2000年)→ 40ドル(2010年)→ 20ドル(2020年)
In Japan, the price of a football ticket was 10 dollars in 2000 before increasing to 40 dollars in 2010 and dropping to 20 dollars in 2020.
日本では、サッカーチケットの価格は2000年に10ドルでしたが、2010年には40ドルに上がり、2020年には20ドルに下がりました。
【直訳】日本では、footballのチケットの価格は、2010年に40ドルに上がり2020年に20ドルに下がる前は2000年には10ドルだった。⇒ 日本では、footballのチケットの価格は、2000年に10ドル、2010年に40ドルに値上がり、2020年に20ドルに値下がりした。
下がって上がる
UK:50ドル(2000年)→ 20ドル(2010年)→ 40ドル(2020年)
In the UK, the price of a football ticket was 50 dollars in 2000 before dipping to 20 dollars in 2010 and recovering to 40 dollars in 2020.
イギリスでは、サッカーチケットの価格は2000年に50ドルでしたが、2010年には20ドルに下がり、2020年には40ドルに回復しました。
【直訳】UKでは、footballのチケットの価格は、2010年に20ドルに下がり2020年に40ドルに上がる前は2000年には50ドルだった。⇒ UKでは、footballのチケットの価格は、2000年に50ドル、2010年に20ドルに値下がり、2020年に40ドルに値上がりした。
付帯状況のwithを使って表現
上って下がる
JAPAN:10ドル(2000年)→ 40ドル(2010年)→ 20ドル(2020年)
In Japan, the price of a football ticket increased from 10 dollars in 2000 with the price reaching a peak of 40 dollars in 2010 but then declining to 20 dollars in 2020.
日本では、サッカーチケットの価格は2000年の10ドルから上昇し、2010年に40ドルのピークを迎えたが、2020年には20ドルまで下落した。
【直訳】日本では、footballのチケットの価格は、2000年に10ドルから値上がりして、その価格は2010年には40ドルに達したが2020年には20ドルに下がった。⇒ 日本では、footballのチケットの価格は、2000年に10ドル、2010年に40ドルに値上がり、2020年に20ドルに値下がりした。
下がって上がる
UK:50ドル(2000年)→ 20ドル(2010年)→ 40ドル(2020年)
In the UK, the price of a football ticket decreased from 50 dollars in 2000 with the price dipping to 20 dollars in 2010 but then rising to 40 dollars in 2020.
イギリスでは、サッカーチケットの価格は2000年の50ドルから下落し、2010年には20ドルまで下がったが、2020年には40ドルまで上昇した。
【直訳】UKでは、footballのチケットの価格は、2000年に50ドルから値下がりして、その価格は2010年には20ドルに値下がったが2020年には40ドルに上がった。⇒ UKでは、footballのチケットの価格は、2000年に50ドル、2010年に20ドルに値下がり、2020年に40ドルに値上がりした。
付帯状況のwithとは
「”メインで言いたいこと”, with 名詞 + 現在分詞 /過去分詞」の形で、メインで言いたいことにその状況を説明することができる。(現在分詞/過去分詞以外にも形容詞、副詞、前置詞もとれるがIELTSでは現在分詞と過去分詞のみを覚えればよい)
with 名詞 + 現在分詞(名詞が”する”)← IELTSではほぼこの表現
食肉の輸出は、1990年から2020年の間に1000万トンから2000万トンへと着実に増加した。
with 名詞 +過去分詞(名詞が”される”)
食肉の輸出は、今後5年間で1000万トンから2000万トンに増加する (だろう) /する可能性が高い/すると予測されている。
関係代名詞を使って状況を説明
上って下がる
JAPAN:10ドル(2000年)→ 40ドル(2010年)→ 20ドル(2020年)
In Japan, the price of a football ticket, which stood at 10 dollars in 2000, increased to 40 dollars in 2010 but then decreased to 20 dollars in 2020.
日本では、2000年に10ドルだったサッカーチケットの価格は、2010年に40ドルまで上昇したが、2020年には20ドルまで下落した。
下がって上がる
UK:50ドル(2000年)→ 20ドル(2010年)→ 40ドル(2020年)
In the UK, the price of a football ticket, which stood at 50 dollars in 2000, decreased to 20 dollars in 2010 but then increased to 40 dollars in 2020.
イギリスでは、2000年に50ドルだったサッカーチケットの価格は、2010年に20ドルまで下落したが、2020年には40ドルまで上昇した。
上がって下がる、そしてまた増える / 下がって上がる、そしてまた下がる
上って下がる・下がって上がるの表現方法を組み合わせることで、「上がって下がって”また”上がる」や「下がって上がって”また”下がる」を表現することができる。(無理につなげて意味不明にならないように要注意)
サッカーチケットの値段の変化
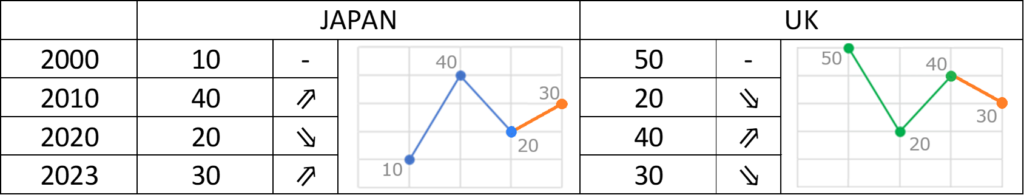
上がって下がって”また”上がる
JAPAN:10ドル(2000年)→ 40ドル(2010年)→ 20ドル(2020年)→ 30ドル(2023年)
In Japan, the price of a football ticket, which stood at 10 dollars in 2000, increased to 40 dollars in 2010 but then decreased to 20 dollars in 2020. After that, it rose again to 30 dollars in 2023.
日本では、2000年に10ドルだったサッカーチケットの価格は、2010年に40ドルまで上昇したが、2020年には20ドルまで下落した。 その後、2023年には再び30ドルまで上昇した。
In Japan, the price of a football ticket, which stood at 10 dollars in 2000, increased to 40 dollars in 2010 but then decreased to 20 dollars in 2020, with the price rising again to 30 dollars in 2023.
日本では、2000年に10ドルだったサッカーチケットの価格は、2010年に40ドルまで上昇したが、2020年には20ドルまで下落し、2023年には再び30ドルまで上昇した。
下がって上がって”また”下がる
UK:50ドル(2000年)→ 20ドル(2010年)→ 40ドル(2020年)→ 30ドル(2023年)
In the UK, the price of a football ticket was 50 dollars in 2000 before dipping to 20 dollars in 2010 but then it recovered to 40 dollars in 2020. After that, it declined again to 30 dollars in 2023.
イギリスでは、2000年に50ドルだったサッカーチケットの価格は、2010年に20ドルまで下落したが、2020年には40ドルまで回復した。 その後、2023年には再び30ドルまで下落した。
In the UK, the price of a football ticket was 50 dollars in 2000 before dipping to 20 dollars in 2010 but then it recovered to 40 dollars in 2020, with the price declining again to 30 dollars in 2023.
英国では、サッカーチケットの価格は2000年に50ドルで、2010年に20ドルに下落したが、2020年に40ドルに回復し、2023年には30ドルに再び下落した。
最低値/最高値への達し方の表現方法
過程の状況を説明しつつ、最終的にはどの値になったのかをto不定詞や接続詞afterを用いて書く。
to不定詞で最後の結果を書く
The sales increased by almost 0.3 million every year for 10 years to reach a peak of three million in 2023.
売上高は10年間毎年30万ドル近く増加し、2023年に300万ドルのピークに達した。
The sales decreased by almost 0.3 million every year for 10 years to reach the lowest point of one million in 2023.
売上高は10年間毎年30万ドル近く減少し、2023年に100万ドルの最低点に達した。
After—で過程を書き、主節で結果を書く
The sales reached a peak of three million in 2023 after increasing by 0.3 million every year for 10 years.
売上高は10年間毎年30万ドル増加し、2023年に300万ドルのピークに達した。
The sales reached the lowest point of three million in 2023 after decreasing by 0.3 million every year for 10 years.
売上高は10年間毎年30万ドル減少し、2023年に300万ドルの最低点に達した。
関係副詞を使ってその時なにがあったかを説明する方法
関係副詞(非制限用法: , when (コンマ when))はいつ何が起きたかを説明するのに使える構文。とくに”需要が供給を超えた”など2つを比較するのに使える。
The demand of steel surged to 200 million tonnes per month in December, when the demand overtook the supply.
鉄鋼の需要は12月に月間2億トンに急増し、需要が供給を上回った。(12月に需要が供給を超えた)
The lowest temperatures recorded in Japan are in February, when conversely they are the highest in Australia.
日本の最低気温は2月で、逆にオーストラリアの最高気温は2月に記録される。
In winter, the need for power gradually increases at a slower pace until evening, when it surges and peaks at about 48000 units at 8 p.m.
冬になると、電力需要は夕方までゆっくりとしたペースで徐々に増加し、午後8時には約48000ユニットでピークを迎えます。
The monthly sales remained steady at £5 million until May, when they fell to roughly £2 million.
月間売上高は5月まで5millionポンドで安定していたが、5月には約2millionポンドに減少した。
IELTSライティングTask 1対策|スタティックグラフ・表で使える表現・書き方
1番・2番・3番の表現方法
一番大きいもの・小さいもの、二番目・三番目を書くことにより要素の比較ができるので1,2,3番の表現方法は必ず覚えておく。
1番大きい・小さい:最上級
Meat exports represented the highest proportion at 55% in 2000, whereas those of fish the lowest at 6%.
2000年には肉の輸出が55%と最も高く、魚の輸出が6%と最も低かった。
Automobile sales took the largest share at 70%, while that of motorbikes the smallest at 5%.
自動車の販売が70%と最も多く、バイクの販売が5%と最も少なかった。
The younger generation consumed cheese the most at 20g per day on average, whereas elderly people eat it the least at 10g.
若い世代が1日平均20gと最も多くチーズを消費しているのに対し、高齢者は10gと最も少ない。
Tennis was the most/least popular of all the games played on the annual day.
年に1度の日に行われる全てのゲームの中でテニスが最も人気があった/なかった。
Tennis was the least popular of all.
テニスはすべての中で最も人気がなかった。
Take the lead
The United States of America takes the lead in exporting computers.
アメリカはコンピューターの輸出で首位をとっている。
The export of automobiles from Japan decreased throughout the decade, which allowed China to take the lead in the global car market.
日本からの自動車の輸出は10年で減少し、それは中国を世界の自動車市場で首位に立たせることにつながった。
2番・3番に大きい・小さい:最上級を使って
Meat sales represented the second/third highest/lowest proportion in 2020.
2020年には肉の販売が2番目/3番目に高かった/最も低かった。
Meat was the second/third most sold product in 2020. (* second/third leastはない(mostのみ))
肉は2020年には2番目/3番目に最もよく売れた。
The second/third most sold product was meat in 2020. (* second/third leastはない(mostのみ))
2020年に売上げが2番目/3番目に多かったのは肉だった。
The second highest amount of water consumption in houses was for hand washing at 20%.
家の中で2番目に多い水の消費量は手洗いで20%を占めた。
Making new friends in foreign countries is the second most difficult thing to deal with for young people.
外国で新しい友達を作ることは、若者にとって2番目に難しいことです。
highest/lowestを使って何番目に大きい/小さいを言うことはできるが、highestをmostを使って書くことはできても、leastを使って書くことはできない。
Meat sales represented the second highest proportion in 2020.
=Meat was the second most sold product in 2020.
肉の売上げは2020年に2番目に高い割合を占めた。(上から2番目)
Meat sales represented the third lowest proportion in 2020.
✖(ダメ) Meat was the third least sold product in 2020. (* second/third leastはない(mostのみ))
肉の売上げは2020年に3番目に低い割合を占めた。(下から3番目)
in first/second/third place (the はつけない)
The proportion of citizens from Great Britain is in first / second / third place at XX%.
1番目、2番目、3番目、4番目の表現方法
1番目、2番目、3番目—の表現は、followed byやfollowingを使って、「XXが最も大きく、YYとZZが続く」と書くことができる。
Followed by
The proportion of citizens from Great Britain is in first place at 60%, followed by those from New Zealand and China at 20% and 10%, respectively.
イギリスから来た人の人口の割合は最も高く60%で、次いで2位はニュージーランドの20%、3位は中国の10%だった。
90% of the population of Japan is made up of Japanese people themselves. This figure is followed by residents from China at 4%, Korea at 3%, Vietnam at 2% and people from other countries at 1%.
日本の人口の90%は日本人です。次いで(残りは)、中国4%、韓国3%、ベトナム2%、その他1%だった。
People having coffee at a cafe accounted for the largest percentage in Hobart at 65%, followed by Brisbane and Adelaide, at approximately 51% and 49%, respectively.
カフェでコーヒーを飲む人の割合が最も高かったのはホバートで65%、次いでブリスベンが約51%、アデレードが約49%だった。
Automobiles represented the largest value of exports in total at £13.8 billion, followed by chemical products at £12.5 billion.
輸出総額で最も多かったのは自動車で13.8billionポンド、次いで化学製品が12.5billionポンドだった。
Following
Water consumption in residences, namely apartments and houses, made up a 70% share of the total, with apartments and houses standing at 57% and 13%, respectively. Following these two categories, industries consumed almost as much water as businesses, with the former at 11% and the latter at 10%.
住居すなわちアパートと一軒家での水の消費は全体の70%を占め、(内訳は)アパートと一軒家でそれぞれ57%と13%だった。 これらの二つのカテゴリーに続いて、産業は企業とほぼ同じ量の水を消費し、前者は11%、後者は10%だった。
Follow
People over 65 years old account for 35% of all cancer patients, and those between 55 and 65 years old follow closely behind at 33%.
65歳以上の人が全がん患者の35%を占め、55歳~65歳の人々が33%と僅差で続いている。
The proportion of citizens from Great Britain is in first place at 60%, and those from New Zealand and China follow at 20% and 10%, respectively.
イギリスから来た人の人口の割合は最も高く60%で、次いで2位はニュージーランドの20%、3位は中国の10%だった。
Automobiles represented the largest value of exports in total at £13.8 billion, and chemical products followed at £12.5 billion.
輸出総額で最も多かったのは自動車で13.8billionポンド、次いで化学製品が12.5billionポンドだった。
Come
The proportion of citizens from Great Britain is in first place at 60%, and New Zealand comes in second at 20%.
イギリスから来た人の人口の割合は最も高く60%で、次いで2位はニュージーランドです。
The proportion of citizens from Great Britain is in first place at 60%, and New Zealand and China come in second and third at 20% and 10%, respectively.
イギリスから来た人の人口の割合は最も高く60%で、次いで2位はニュージーランドの20%、3位は中国の10%だった。(followed byと同じ)
Tie(同じ)
China and India tie for second place in exporting computers.
中国とインドはコンピューターの輸出で2位で並んでいる。
The United States of America takes the lead in producing computers at 50%, while China and India tie in second place at 20% each.
アメリカは50%でコンピューターの製造において首位をとっている一方で、中国とインドはそれぞれ20%で2位で並んでいる。
比較級
比較対象のうちどちらが大きいかは比較級で表す。
Automobile sales took a larger share than motorbikes at 70% and at 5%, respectively.
自動車販売はバイクよりも大きな割合を占め、それぞれ70%(自動車)と5%(バイク)だった。
The younger generation consumed more cheese than elderly people at 20g per day and 10g, respectively, on average.
若い世代は1日平均でそれぞれ20gと10gのチーズを高齢者よりも多く消費した。
何倍/何分の一の表現方法
比較をする際にどの程度どちらが大きいかを倍数表現で表す。
何倍:times / times as — as (2倍はtwice)
Japan exports automobiles worth £5.9 billion to the world, which is nearly five times the amount of money made from exporting food.
日本は5.9billionポンド相当の自動車を世界に輸出しているが、これは食品の輸出額のほぼ5倍にあたる。
The amount of butter eaten by those in the 45-65 age group stands at 60g, which is twice as much as that consumed by people over 65 and five times as much as those under 25.
バターの45-65歳の消費量は60gで、それは65歳以上の消費量の2倍、25歳未満の消費量の5倍である。
In terms of the automobile industry, the value of exports from Japan stood at £13.8 billion in 2010, which was ten times as much as the UK sold.
自動車産業に関しては、2010年の日本からの輸出額は138億ポンドで、イギリスの10倍であった。
何分の一:序数(1/2はhalf)
Residents used 15% of water for toilets, which was three-quarters the amount for washing clothes (20%). 10% of water was used in the kitchen, which was half the amount for washing clothes.
住民は15%の水をトイレに使用し、これは洗濯 (20%) の3/4であった。台所では10%の水を使用していましたが、これは洗濯の半分の量です。
Industries and businesses accounted for roughly a fifth of water used in homes, standing at 11% and 10% of the overall water use, respectively.
(homeでの水の使用料は50%:industries(11%)もbusinesses(10%)もその約1/5)
産業と企業で使用される水の量は家庭で使用される水の約1/5で、全体の水使用量のそれぞれ11%と10%を占めています。
Graduates working as freelance consultants received a relatively higher income with four-fifths of them earning more than $75,000.
フリーランスのコンサルタントとして働いている卒業生の収入は比較的高く、4/5(80%)が75,000ドル以上を稼いでいます。
序数の使い方: — には序数が入り何分の何を表す
The number of X is —- of Y.
1/2: half → XはYの半分です。
1/3: one third → XはYの1/3です。
1/4: quarter → XはYの1/4です。
2/5: two fifths → XはYの2/5です。
3/4: three quarters → XはYの3/4です。
5/7: five sevenths → XはYの5/7です。
何倍と何分の一のパラフレイズ
In Japan, the consumption of meat is half that of fish.
日本では、肉の消費量は魚の半分です。
=In Japan, the consumption of fish is double that of meat.
日本では、魚の消費量は肉の2倍です。
=In Japan, the consumption of fish is twice that of meat.
日本では、魚の消費量は肉の2倍です。
In Taiwan, the consumption of meat is one-third that of fish.
台湾では、肉の消費量は魚の1/3です。
=In Taiwan, the consumption of fish is three times as much as that of meat.
台湾では、魚の消費量は肉の3倍です。
In India, the consumption of meat is one-fourth that of fish.
インドでは、肉の消費量は魚の1/4です。
=In India, the consumption of fish is quadruple that of meat.
インドでは、魚の消費量は肉の4倍です。
=In India, the consumption of fish is four times as much as that of meat.
インドでは、魚の消費量は肉の4倍です。
In Vietnam, the consumption of meat is three-quarters that of fish.
ベトナムでは、肉の消費量は魚の3/4です。
=In Vietnam, the consumption of fish is less than that of meat by one quarter.
ベトナムでは、魚の消費量は肉より1/4少ない。
In China, the consumption of meat is five-sevenths that of fish.
中国では、肉の消費量は魚の5/7です。
=In China, the consumption of fish is less than that of meat by two-sevenths.
中国では、魚の消費量は肉より2/7少ない。
同じくらい
Tennis was as popular as basketball.
テニスはバスケと同じくらい人気があった。
Tennis and baseball were equally popular.
テニスはバスケと同じくらい人気があった。
Tennis was not as popular as basketball. (as as 構文の否定形:ほど—ではない)
テニスはバスケほど人気がなかった。
The proportion of city dwellers from the UK is almost the same as that from New Zealand at approximately 90%.
イギリスの都市生活者の割合は、ニュージーランドの約90%とほぼ同じです。
The daily consumption of milk by the 26-45 age group is almost as much as the 45-65 age group at around 1660ml.
牛乳の1日の消費量は、26-45歳が約1660mlで、これは45-65歳とほぼ同じ量です。
数値の説明の表現方法
数値を説明する際は、ただ何が何%だったかを書くのではなく、その説明(例:何が最も大きく何%であった / 何が何%で最も大きかった)を加えながら書く。その際に、”付帯状況のwithを使って数値を追加”、”分詞構文を使って数値を追加”、”関係代名詞を使って数値を追加”、”関係代名詞を使って説明を追加”する表現が使える。
付帯状況のwithを使って数値を追加
The most challenging aspect for young people is making new friends, with 53% of those surveyed reporting this.
若者にとって最も難しいことは新しい友人を作ることで、調査対象者の53%がこれを報告した。
The oldest age group finds making friends the easiest, with the proportion of people finding it a challenge standing at only 10%.
最も高い年齢層では、友人を作ることが最も簡単であり、難しいと感じる人の割合はわずか10%であった。
As for the dwelling areas, cities are far more popular than the countryside, with more than 80% of people living there.
居住地域については、地方よりも都市部の方がはるかに人気があり、80%以上の人がそこに住んでいる。
Graduates working as freelance consultants received a relatively higher income, with half of them earning over $100,000.
フリーランスのコンサルタントとして働いている卒業生は比較的高い収入を得ており、半数が10万ドル以上を稼いでいる。
The minority of the students decided to study further on a postgraduate course, with 8% of the total entirely focusing on advanced studying and 5% of them choosing to continue studying while also working part-time.
(Synonym: postgraduate course=advanced studying=continue studying)
大学院でさらに勉強することを決めた学生は少数派で、全体の8%が大学院での勉強に専念し、5%がアルバイトをしながら勉強を続けることを選んだ。
The majority of water use in Japan was in the residential sector, with 57% used in houses and 13% used in apartments.
日本の水使用の大部分は住宅で使用されており、一軒家で57%、アパートで13%が使用されている。
付帯状況のwithとは
「”メインで言いたいこと”, with 名詞 + 現在分詞 /過去分詞」の形で、メインで言いたいことにその状況を説明する。(現在分詞/過去分詞以外にも形容詞、副詞、前置詞もとれるがIELTSでは現在分詞と過去分詞のみを覚えればよい)
with 名詞 + 現在分詞(名詞が”する”)← IELTSではほぼこの表現
Meat exports represented the majority of trade at 60%.
⇓
Meat exports represented the majority of trade, with the proportion standing at 60%.
食肉の輸出は60%で貿易の大部分を占めている。
with 名詞 +過去分詞(名詞が”される”)
Meat exports will / are likely to / are forecast to represent the majority of trade in the near future at 60%.
⇓
Meat exports will (probably) / are likely to / are forecast to represent the majority of trade in the near future, with the proportion expected to stand at 60%.
近い将来、食肉の輸出が貿易の大半を占めると予想される。
分詞構文を使って数値を追加
The proportion of people owning cars is lower for the older age group, standing at 36%.
車を所有している人の割合は高齢者ほど低く、36%である。
The export values of automobiles and bicycles were unique as the figures outnumber those of imports, accounting for £4 billion and £2.3 billion, respectively.
自動車と自転車の輸出額は、それぞれ4billionポンドと2.3billionポンドで、輸入額を上回っている。
関係代名詞を使って数値を追加
The people who immigrated from other countries are categorized as “Other”, which accounts for 14%.
外国から移住した人は「その他」に分類され、14%を占める。
Milk consumption by the under 18 group is the lowest at 1200 ml per day, of which 59% is full fat and 41% low fat.
18歳未満のグループの牛乳消費量は1日1200 mlで最も少なく、そのうち59%がFull fat、41%がLow fat(低脂肪)である。
関係代名詞を使って説明を追加
Nearly half of those over 55 years old find it difficult to learn a new language, which is the biggest obstacle for them when living abroad.
55歳以上の半数近くが新しい言語を学ぶのを難しいと感じており、それが海外生活での最大の障害となっている。
60% of Chinese people live in cities, which is far greater than the other countries.
中国人の60%が都市に住んでおり、これは他の国よりもはるかに多い。
The amount of butter eaten by those in the 45-65 age group stands at 60g, which is the largest for all age groups. Milk consumption by the under 18 group is the lowest at 1200 ml per day, of which 59% is full fat and 41% low fat.
45-65歳のバターの摂取量は60gで、すべての年齢層で最も多い。18歳未満のグループの牛乳消費量は1日1200 mlで最も少なく、そのうち59%がFull fat、41%がLow fat(低脂肪)である。
比較表現
スタティックグラフ・表は、ただ数字を書くだけではなく、接続詞、副詞、前置詞(句)を用いて数字を比べて書く。
接続詞:while / whereas (whereasは文頭では使えない)
People in the oldest age group (over 65) drink the most milk at 1900ml, whereas/while those in youngest group (under 25) drink the least at 1200ml.
最も高齢のグループ (65歳以上) は1900mlと最も多くの牛乳を飲むが、最も若いグループ (25歳未満) は1200mlで最も少ない。
More people over 26 years old prefer low fat milk than full fat milk, whereas/while this trend is the opposite for those under 26.
26歳以上では、Full fatの牛乳よりもLow fat(低脂肪)の牛乳を好む人が多いが、26歳未満ではこの傾向は逆である。
副詞:conversely (反対に)
More people over 26 years old prefer low fat milk than full fat milk. Conversely, this trend is the opposite for those under 26.
26歳以上では、Full fatの牛乳よりもLow fat(低脂肪)の牛乳を好む人が多い。 逆に、26歳未満ではこの傾向は逆である。
前置詞(句):unlike, in comparison, on the other hand, compared to
The figure for the 18-34 age group stands at nearly 30% and compared to the 35-54 age group, it is 6% lower. (compared to + 比較対象:18-34 age groupと35-54 age groupの比較)
18~34歳は30%近くで、35~54歳と比べると6%少ない。
IELTSライティングTask 1対策|地図で使える表現・書き方
使える構文
分詞構文:結果—なった
The library has expanded leading to an increased number of books.
図書館が拡大し、蔵書数が増えた。
—することによって: by
Some new facilities have been added by eliminating some greenery.
緑を減らして新しい施設を増やした。
A new research facility was developed by cutting trees down.
木を伐採して新しい研究施設を開発した。
—一方で—
The building for cyber security has been expanded, whereas the area for the car park has been reduced.
サイバーセキュリティのための建物を拡張し、駐車場の面積を減らした。
The west side of the university has the library, while the east has the laboratory.
大学の西側には図書館があり、東側には研究室がある。
地図でa/theの使い分け
もとからあるもの/変わる前のものにはtheを付けて新しいものはa/anを付けるか複数。(過去から過去、過去から現在、現在から未来の変化でも同じ)新しいものでも一度a/an/複数で書いたらその次からは”その(新しい—)”になるのでtheをつける。
The library, which was on the east side of the city in 1990, had been relocated to the north side by 2000.
(Libraryはもと(1990年)からある)
1990年に市の東側にあった図書館は、2000年までには北側に移転していた。
The car park has been replaced by a hospital.
(駐車場(変わる前のもの)の場所に病院(新しいもの)ができた)
駐車場は病院になった。
The museum is scheduled to be renovated to facilitate a new wheelchair friendly toilet and computers.
(ミュージアム(もとからある)にはバリアフリートイレ(新しいもの)とコンピューター(新しいもの)が付くように改装される予定)
博物館は、車椅子に優しい新しいトイレとコンピュータを利用できるように改修される予定である。
過去/現在/未来を表す副詞/表現
過去:In the past, In 2020
In the past, there was a lot of greenery alongside the river running through the northern part of the city.
昔は市の北部を流れる川沿いに多くの緑が多かった。
かつては—だった:used to be
An indoor facility was made to contain a swimming pool, a café and changing rooms, which used to be in the open air.
かつて屋外にあったプールやカフェ、更衣室を含む屋内施設が建てられた。
The new facility will have a fitness centre in the place where the tennis courts used to be.
新しい施設は、テニスコートがあった場所にフィットネスセンターを併設する。
現在:presently, At present, currently, after (the modification)
Presently, the layout has changed dramatically. (レイアウトが変わって今も変わった後の状態が続いているので現在完了形)
現在、レイアウトが大幅に変更されている。
At present, there is a new library on the north side of the university.
現在、大学の北側に新しい図書館がある。
未来:in the future, for the future
The map illustrates the present layout of the university and also the changes proposed for the future.
この地図は、大学の現在の配置と、提案された将来の変更を示している。
IELTSライティングTask 1対策|プロセスで使える表現・書き方
プロセスを書く際には、何がはじめにきて、次に何があって、その次に何があるのか、順番が分かるように書く。
プロセスの流れを表現する語句(接続詞、副詞)を覚えて流れを色々な表現でできるようにすることが必要。(First,—. Next,—, Next, —. Next, —ではスコアはでない)
順番の書き方
初めに

Firstly/Initially/First of all/To start with/To begin with
Firstly, used plastic bottles are collected in a designated container.
Initially, used plastic bottles are collected in a designated container.
First of all, used plastic bottles are collected in a designated container.
To start with, used plastic bottles are collected in a designated container.
To begin with, used plastic bottles are collected in a designated container.
まず、使用済みペットボトルは指定された容器で回収される。
commence/start/begins
Recycling commences when used plastic bottles are collected in a designated container.
Recycling starts when used plastic bottles are collected in a designated container.
Recycling begins when used plastic bottles are collected in a designated container.
使用済みペットボトルを指定された容器に回収することからリサイクルが始まる。
The first step
The first step is to collect used plastic bottles in a designated container.
はじめに使用済みペットボトルは指定された容器で回収される。
次に

Then/subsequently/afterwards
Then, a garbage truck carries the collected bottles to a recycling centre.
Subsequently, a garbage truck carries the collected bottles to a recycling centre.
Afterwards, a garbage truck carries the collected bottles to a recycling centre.
その後、ゴミ収集車が回収したペットボトルをリサイクルセンターに運ぶ。
After that,/After
After that, a garbage truck carries the collected bottles to a recycling centre.
その後、ゴミ収集車が回収したペットボトルをリサイクルセンターに運ぶ。
After transportation to the recycling centre, the plastic bottles are sorted automatically.
リサイクルセンターに運ばれた後、ペットボトルは自動的に分別される。
prior to / before
Used plastic bottles are collected in a designated container, prior to/before being carried by a garbage truck.
使用済みペットボトルは、ゴミ収集車が運ぶ前に、指定された容器に回収される。
followed by
Used plastic bottles are collected in a designated container, followed by being collected/collection by a garbage truck.
Used plastic bottles are collected in a designated container, followed by a garbage truck collecting them.
使用済みペットボトルを指定の容器に回収し、ゴミ収集車で回収します。
Next/Then
Next/Then, the compressed blocks of bottles are crushed into small pieces by sharp, circular rollers.
次いで圧縮されたペットボトルの塊を、鋭い円形のローラーで細かく砕きます。
The pellets are then heated until they melt.
ペレットは溶けるまで加熱されます。
and then
The compressed blocks of bottles are crushed into small pieces by rollers, and then the crushed pieces are dropped into a container filled with water.
圧縮されたペットボトルの塊をローラーで細かく砕き、水を入れた容器に落ちます。
and subsequently
The skin is thoroughly washed with water in a container, and subsequently the individual sheets of skin are soaked in another container filled with lime.
容器の中で皮を水でよく洗い、次にLimeを入れた別の容器に皮を1枚ずつ浸します。
Subsequent to
Firstly, the leather skins from various animals are dried. Subsequent to this, they are carried to a factory by truck where they are sorted by hand.
まず、様々な動物の皮を乾燥させます。 その後、トラックで工場に運ばれ、手作業で仕分けされます。
Following this step
Following this step, the compressed blocks of bottles are crushed into small pieces by sharp, circular rollers.
このステップに続いて、圧縮されたペットボトルの塊を、鋭い円形のローラーで細かく砕きます。
Once
Once the pellets are heated until they melt, the liquefied pellets are poured into a mould to shape bottles.
ペレットが溶けるまで加熱された後に、液化したペレットは型に流し込まれボトルの形になります。
最後に/最終的に
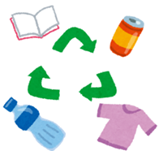
Finally/Ultimately
Finally, some products, such as plastic containers, T-shirts, pencils as well as plastic bags are made.
Ultimately, some products, such as plastic containers, T-shirts, pencils as well as plastic bags are made.
最後に、プラスチック容器、Tシャツ、鉛筆、ビニール袋などの製品が作られます。
順番を表すのに使える構文
followed by
This circular process is comprised of three main stages including initial collection and sorting, followed by processing and cleaning, and finally making some products. (順番:collection and sorting ⇒ processing and cleaning ⇒ producing some products)
この循環プロセスは、最初の収集と選別、その後の処理と洗浄、最後にいくつかの製品を作るという3つの主要なステージで構成されています。
before
Then, the sheet is polished using equipment before being transferred by a lorry to another factory.(順番:sheet polishing ⇒ lorry ⇒ another factory)
その後、シートは機械で研磨され、トラックで別の工場に運ばれる。
The harvested vegetables are washed automatically before being cut by a machine with large rollers. (順番:washing vegetables ⇒ cut)
収穫された野菜は、大きなローラーのついた機械でカットされる前に自動的に洗浄される。
after which
The skins are thoroughly washed with water and lime in a large container, after which the individual sheets are soaked in another container filled with lime.
皮は大きな容器の中で水と石灰で徹底的に洗浄され、その後、個々のシートは石灰を入れた別の容器に浸漬される。
IELTSライティングTask1サンプル
IELTSライティングTask 1対策|基礎サンプル:ダイナミック
ライティングTask 1|基礎サンプル1:ダイナミック折れ線グラフ
The chart below shows the changes that took place in three different areas of crime in Mexico City from 2010 to 2019.
Summarise the information by selecting and reporting the main features, and make comparisons where relevant.
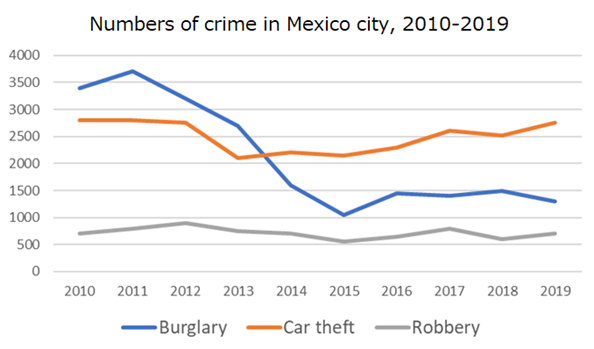
ボディ1とボディ2への分け方
ダイナミックグラフは期間の最初(2010年)と最後(2019年)を比較して変化をつかむ
- ボディ1: Burglaryは減少
- ボディ2:Car theftとRobberyはほぼ同じ
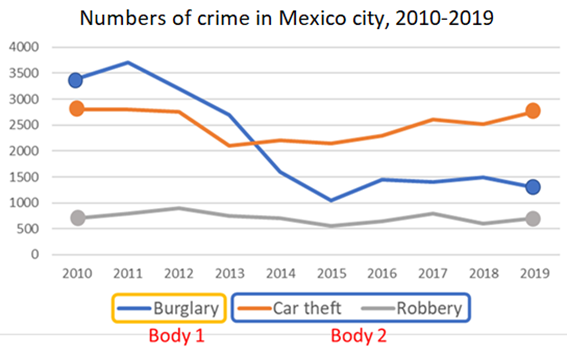
特徴の捉え方
ボディ1:Burglaryの大きな特徴
- 2010年:数が最も多い
- 2011年:数百増える
- 2015年:減り続けて1000ちょっとに
- 2016年:1500近くまで増えて2018まで同じ
- 2019年:少し減り1500弱に
ボディ2:Car theftとRobberyの大きな特徴
- 2010年:Car theftとRobberyはそれぞれ2800と700
- Car theft
- 2012まで同じ数、2013年に2000ちょいに減る
- その後徐々に増え2013年にはBurglaryを超える
- 2019年と同じくらいの数に戻る
- Robbery
- 期間を通して500-1000の間で小さな変動、2010年と2019年は700くらい
イントロダクション
パラフレイズ
問題文)The chart below shows the changes that took place in three different areas of crime in Mexico City from 2010 to 2019.
パラフレイズ)The line graph illustrates how the number of incidents of crime in three categories in Mexico City changed between 2010 and 2019.
折れ線グラフは、メキシコシティの3つのカテゴリーの犯罪件数が2010年から2019年の間にどのように変化したかを示している。
Overall
- burglaryは激減
- car theftとrobberyはあまり変化なし
- robberyはずっと低い
Overall, the number of burglaries decreased dramatically, whereas figures for car theft and robbery saw some slight fluctuations. Furthermore, robbery remained the least occurring crime over the period.
全体として、空き巣(Burglary)の件数は劇的に減少したが、自動車盗難と強盗(Robbery)の数字には若干の変動が見られた。さらに、強盗はこの期間に発生した犯罪の中で最も少なかった。
ボディ
ボディ 1:Burglary
- 2010年:数が最も多い(3500件)
- 2011年:数百増える
- 2015年:減り続けて1000ちょっとに
With regards to burglary, the number began at just below 3500 cases in 2010, which was the highest among the three categories, before increasing by a few hundred in 2011 and then declining continuously until 2015 to just 1000.
空き巣(Burglary)については、2010年に3500件弱で始まり、3つのカテゴリーの中で最も多かったが、2011年に数百件増加し、その後2015年まで減少を続け、わずか1000件となった。
- 2016年:1500近くまで増えて2018まで同じ
- 2019年:少し減り1500弱に
After that, the figure rose to nearly 1500 in 2016 and levelled off until 2018, before dropping slightly to just under 1500 in 2019.
その後、2016年には1500件近くまで上昇し、2018年まで横ばいで推移した、2019年には1500件弱にやや減少した。
ボディ 2:Car theft, Robbery
- 2010年:Car theftとRobberyはそれぞれ2800と700
The number of cars being stolen and robberies taking place stood at approximately 2800 and 700, respectively, in 2010.
2010年の自動車盗難件数は約2800件、強盗件数は約700件であった。
- Car theft:2012まで同じ数、2013年に2000ちょいに減る
The former remained unchanged until 2012 before falling to just above 2000 in 2013.(* former = cars being stolen = car theft)
前者は2012年まで横ばいで推移したが、2013年には2000件強まで減少した。
- Car theft:その後徐々に増え2013年にはBurglaryを超え、2019年と同じくらいの数に戻る
After that, it began to grow gradually and surpassed the number of burglaries in the middle of 2013 to reach almost the same number in 2019 as at the beginning of the period.
その後、徐々に増加に転じ、2013年半ばには強盗件数を上回り、2019年には期初とほぼ同数となった。
- Robbery:期間を通して500-1000の間で小さな変動、2010年と2019年は700くらいで同じ
As for robbery, incidences hovered around the 750 mark and did not fall below 500 or exceed 1000 throughout the period, with the number at the end being the same as at the start.
強盗件数は750件前後で推移し、500件を下回ることも1000件を超えることもなく、期間の最初と最後は同数だった。
全体
The line graph illustrates how the number of incidents of crime in three categories in Mexico City changed between 2010 and 2019. Overall, the number of burglaries decreased dramatically, whereas figures for car theft and robbery saw some slight fluctuations. Furthermore, robbery remained the least occurring crime over the period.
折れ線グラフは、メキシコシティの3つのカテゴリーの犯罪件数が2010年から2019年の間にどのように変化したかを示している。全体として、空き巣(Burglary)の件数は劇的に減少したが、自動車盗難と強盗(Robbery)の数字には若干の変動が見られた。さらに、強盗はこの期間に発生した犯罪の中で最も少なかった。
With regards to burglary, the number began at just below 3500 cases in 2010, which was the highest among the three categories, before increasing by a few hundred in 2011 and then declining continuously until 2015 to just 1000. After that, the figure rose to nearly 1500 in 2016 and levelled off until 2018, before dropping slightly to just under 1500 in 2019.
空き巣(Burglary)については、2010年に3500件弱で始まり、3つのカテゴリーの中で最も多かったが、2011年に数百件増加し、その後2015年まで減少を続け、わずか1000件となった。その後、2016年には1500件近くまで上昇し、2018年まで横ばいで推移した、2019年には1500件弱にやや減少した。
The number of cars being stolen and robberies taking place stood at approximately 2800 and 700, respectively, in 2010. The former remained unchanged until 2012 before falling to just above 2000 in 2013. After that, it began to grow gradually and surpassed the number of burglaries in the middle of 2013 to reach almost the same number in 2019 as at the beginning of the period. As for robbery, incidences hovered around the 750 mark and did not fall below 500 or exceed 1000 throughout the period, with the number at the end being the same as at the start.
2010年の自動車盗難件数は約2800件、強盗件数は約700件であった。前者は2012年まで横ばいで推移したが、2013年には2000件強まで減少した。その後、徐々に増加に転じ、2013年半ばには強盗件数を上回り、2019年には期初とほぼ同数となった。強盗件数は750件前後で推移し、500件を下回ることも1000件を超えることもなく、期間の最初と最後は同数だった。
ライティングTask 1|基礎サンプル2:ダイナミック棒グラフ
The chart below gives information about the price of tickets on one airline between Edinburgh and London over a two-week period in 2013.
Summarise the information by selecting and reporting the main features, and make comparisons where relevant.
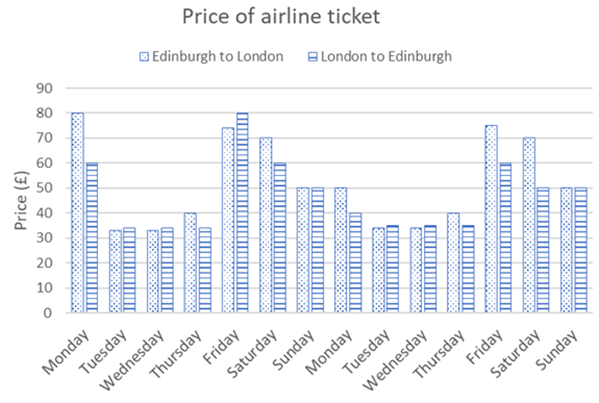
ボディ1とボディ2への分け方
Edinburgh→LondonとLondon→Edinburghの料金の比較をさせている問題である
ボディ1もボディ2でもEdinburgh→LondonとLondon→Edinburghの比較ができるように第1週をボディ1に、第2週をボディ2にする。
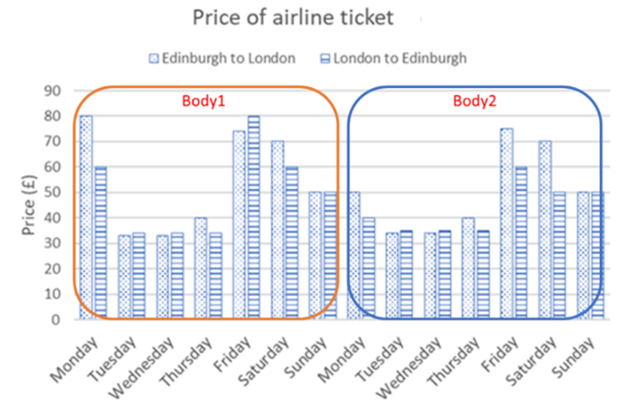
特徴の捉え方
解説のためにEdinburgh→LondonとLondon→Edinburghをそれぞれのグラフに分ける。
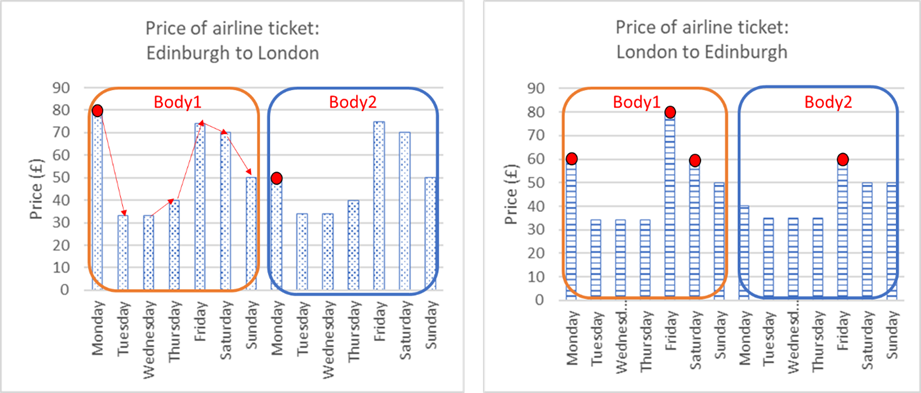
ボディ1: 第1週
- Edinburgh→Londonは月曜に最も高い£80
- 火曜/水曜£35、木曜£40くらい
- 金曜に£75に上がる
- 土曜に£70に下がり、日曜に£50
- London→Edinburghも似たパターンだけど金曜が最高値の£80
- (Edinburgh→Londonで最高値の)月曜は£60、水曜も同じくらいの£60
ボディ2: 第2週
- Edinburgh→Londonは月曜が£50(週に(1番ではなく)3番目に高い)であること以外第1週と毎日同じ値段
- London→Edinburghは第1週よりは変化が少ない
- 月曜に£40、火曜~木曜に£35、土日は£50、金曜に最高値の£60
イントロダクション
パラフレイズ
問題文)The char below give information about the price of tickets on one airline between Edinburgh and London over a two-week period in 2013.
パラフレイズ) The bar graph illustrates fluctuations of the airline ticket price from Edinburgh to London as well as the return trip for two weeks in 2013.
棒グラフは、2013年のエディンバラ-ロンドン間とその復路の航空券の価格の変動を示している。
Overall
- 金曜から月曜は高めで火水曜は低めである点は似ている
Overall, the trends of week 1 and 2 are similar with the price being higher over the weekend and the lowest on Tuesday and Wednesday.
全体的に、第1週と第2週の傾向は似ており、週末に価格が高くなり、火曜日と水曜日に価格が低くなります。
ボディ
ボディ 1:第1週
- Edinburgh→Londonは月曜に最も高い£80
- 火曜/水曜は£35に下がる (木曜£40は特に重要な情報ではないので省略)
During the first week, the price from Edinburgh to London started from a peak of £80 on Monday before fell sharply to just over £30 on Tuesday and Wednesday.
第1週のエディンバラ-ロンドン間の価格は、月曜日の80ポンドのピークから始まり、火曜日と水曜日には30ポンド強に急落しました。
- 金曜に£75に上がる
- 土曜に£70に下がり、日曜に£50
After that, it soared to approximately £75 on Friday but dropped to £70 and subsequently to £50 over the weekend.
その後、金曜日には約75ポンドまで高騰したが、週末には70ポンド、その後50ポンドまで下落した。
- London→Edinburghも似たパターンだけど金曜が最高値の£80
- (Edinburgh→Londonで最高値の)月曜は£60、土曜も同じくらいの£60
A similar pattern was seen for the return tickets, although the peak was on Friday at £80 and the price on Monday was as expensive as on Saturday at £60.
帰りの航空券についても同様のパターンが見られたが、ピークは金曜日の80ポンドで、月曜日の価格は土曜日と同じ60ポンドだった。
ボディ2:第2週
- Edinburgh→Londonは月曜が£50(週に(1番ではなく)3番目に高い)であること以外第1週と毎日同じ値段
The next week, as for tickets from Edinburgh to London, the price on each day was the same as the first week apart from on Monday when the price was £50.
翌週のエディンバラ-ロンドン間の航空券については、月曜日の50ポンドを除いて、各日の価格は第1周と同じだった。
- London→Edinburghは第1週よりは変化が少ない
- 月曜に£40、火曜~木曜に£35、土日は£50、金曜に最高値の£60
The return tickets in the second week did not fluctuate so much, compared to the first week, with the price being £40 on Monday, falling marginally to £35 from Tuesday to Thursday, and then rising to £50 at the weekend, while it reached a peak of £60 on Friday.
第2週の帰りの航空券は、最初の週と比べてあまり変動しなかった。月曜日の40ポンド、火曜日から木曜日にかけて35ポンドまでわずかに下落し、週末には50ポンドまで上昇した。金曜日には60ポンドのピークに達した。
全体
The bar graph illustrates fluctuations of the airline ticket price from Edinburgh to London as well as the return trip for two weeks in 2013. Overall, the trends of week 1 and 2 are similar with the price being higher over the weekend and the lowest on Tuesday and Wednesday.
棒グラフは、2013年のエディンバラ-ロンドン間とその復路の航空券の価格の変動を示している。全体的に、第1週と第2週の傾向は似ており、週末に価格が高くなり、火曜日と水曜日に価格が低くなります。
During the first week, the price from Edinburgh to London started from a peak of £80 on Monday before fell sharply to just over £30 on Tuesday and Wednesday. After that, it soared to approximately £75 on Friday but dropped to £70 and subsequently to £50 over the weekend. A similar pattern was seen for the return tickets, although the peak was on Friday at £80 and the price on Monday was as expensive as on Saturday at £60.
第1週のエディンバラ-ロンドン間の価格は、月曜日の80ポンドのピークから始まり、火曜日と水曜日には30ポンド強に急落しました。その後、金曜日には約75ポンドまで高騰したが、週末には70ポンド、その後50ポンドまで下落した。帰りの航空券についても同様のパターンが見られたが、ピークは金曜日の80ポンドで、月曜日の価格は土曜日と同じ60ポンドだった。
The next week, as for tickets from Edinburgh to London, the price on each day was the same as the first week apart from on Monday when the price was £50. The return tickets in the second week did not fluctuate so much, compared to the first week, with the price being £40 on Monday, falling marginally to £35 from Tuesday to Thursday, and then rising to £50 at the weekend, while it reached a peak of £60 on Friday.
翌週のエディンバラ-ロンドン間の航空券については、月曜日の50ポンドを除いて、各日の価格は第1周と同じだった。第2週の帰りの航空券は、最初の週と比べてあまり変動しなかった。月曜日の40ポンド、火曜日から木曜日にかけて35ポンドまでわずかに下落し、週末には50ポンドまで上昇した。金曜日には60ポンドのピークに達した。
ライティングTask 1|基礎サンプル3:ダイナミック円グラフ
The pie charts below show the percentage of five kinds of books sold by a bookseller between 1982 and 2002.
Summarise the information by selecting and reporting the main features, and make comparisons where relevant.
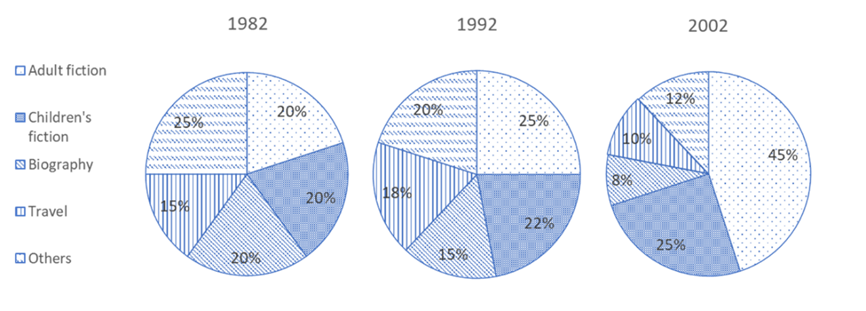
ボディ1とボディ2への分け方
ダイナミックグラフは期間の最初(1982年)と最後(2002年)を比較して変化をつかむ
- ボディ1:増加したジャンル=Adult fiction, Children’s fiction
- ボディ2:減少したジャンル=Biography, Travel, Others
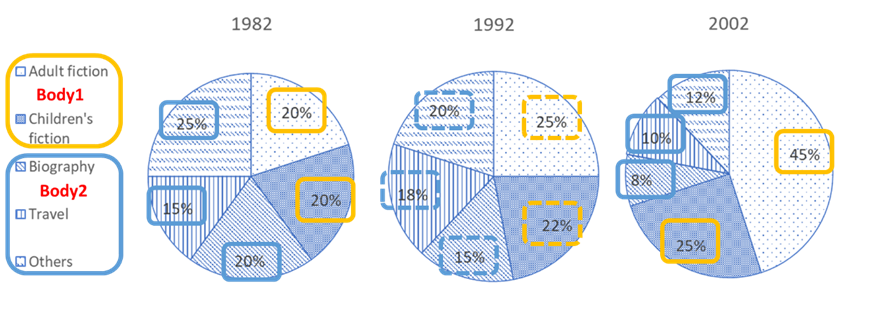
特徴の捉え方
ここでは参考のために、ボディ1では年ごとの特徴、ボディ2では種類ごとの特徴にまとめた。どちらかに統一する必要はない。
ボディ1:Adult fiction, Children’s fiction
- Adult fictionとChildren’s fictionは1982年から2002年で増えた
- 1982年:Adult fictionとChildren’s fictionはそれぞれ20%
- 1992年:Adult fictionは25%、Children’s fictionは22%に上昇
- 2002年:Adult fictionは45%、Children’s fictionは25%に上昇(1982年比でそれぞれ倍、+5%)
ボディ 2:Biography, Travel, Others
- Biography:20%(1982年)→ 15%(1992年)→ 8%(2002年)
- Others:25%(1982年)→ [20%(1992年)]→ 12%(2002年)
- Travel:15%(1982年)→ +3%(1992年)]→ -10%(2002年)
イントロダクション
パラフレイズ
問題文)The charts below show the percentage of five kinds of books sold by a bookseller between 1982 and 2002.
パラフレイズ)The pie charts illustrate the proportion of books of different genres which were sold from 1982 to 2002 at one-decade intervals.
円グラフは、1982年から2002年までに10年ごと販売された異なるジャンルの本の割合を示している。
Overall
増加:adult fiction and children’s fiction
減少:Biography, Travel, Others
Overall, the proportion of adult fiction and children’s fiction increased, whereas that of the other three kinds, biography, travel, and others, decreased over the period.
全体的には、成人向け小説と児童向け小説の割合が増加したが、他の三種類 (伝記、旅行、その他) の割合は減少した。
ボディ
ボディ 1:Adult fiction, Children’s fiction
- Adult fictionとChildren’s fictionは1982年から2002年で増えた
The categories of adult fiction and children’s fiction underwent continuous growth.
成人向け小説と児童向け小説のカテゴリーは継続的に増加した。
- 1982年:Adult fictionとChildren’s fictionはそれぞれ20%
- 1992年:Adult fictionは25%、Children’s fictionは22%に上昇
Both stood at one fifth in 1982, and the former had grown to a quarter and the latter had risen 2% by 1992.
1982年には両方とも1/5(20%)であったが、1992年には前者は1/4(25%)に増加し、後者は2%増加した。
- 2002年:Adult fictionは45%、Children’s fictionは25%に上昇(1982年と比べるとそれぞれ2倍、+5%)
During the two decades from 1982 to 2002, adult fiction sales more than doubled to represent 45% and children’s fiction rose by 5%, resulting in the subtotal proportion of these two genres making up a 70% share in 2002.
1982年から2002年の間に、成人向け小説の売り上げは倍以上の45%に、児童向け小説は5%増加し、2002年にはこれら2つのジャンルの小計の割合は70%となった。
ボディ 2:Biography, Travel, Others
- Biography:20%(1982年)→ 15%(1992年)→ 8%(2002年)
Biography, which took the same proportion as the aforementioned two categories in 1982, lost popularity from 20% in 1982 to 15% in 1992 and to only 8%, the lowest proportion, in 2002.
1982年に前述の2つのカテゴリーと同じ割合を占めていた伝記は、1982年の20%から1992年には15%に減少し、2002年には最も低い8%になった。
- Others:25%(1982年)→ [20%(1992年)]→ 12%(2002年)
Also, the ‘others’ category declined from 25% to less than half at 12% over the period with the percentage standing at one fifth in 1992.
また、「その他」のカテゴリーは25%から半分以下の12%に減少し、1992年の割合は1/5(20%)であった。
- Travel:15%(1982年)→ +3%(1992年)→ –10%(2002年)
With regards to travel, starting from 15%, it saw a slight rise of 3% from 1982 to 1992, while the proportion had dipped to 10% by 2002.
旅行に関しては、15%から始まり、1982年から1992年には3%とわずかに増加したが、2002年には10%に減少した。
全体
The pie charts illustrate the proportion of books of different genres which were sold from 1982 to 2002 at one-decade intervals. Overall, the proportion of adult fiction and children’s fiction increased, whereas that of the other three kinds, biography, travel, and others, decreased over the period.
円グラフは、1982年から2002年までに10年ごと販売された異なるジャンルの本の割合を示している。全体的には、成人向け小説と児童向け小説の割合が増加したが、他の三種類 (伝記、旅行、その他) の割合は減少した。
The categories of adult fiction and children’s fiction underwent continuous growth. Both stood at one fifth in 1982, and the former had grown to a quarter and the latter had risen 2% by 1992. During the two decades from 1982 to 2002, adult fiction sales more than doubled to represent 45% and children’s fiction rose by 5%, resulting in the subtotal proportion of these two genres making up a 70% share in 2002.
成人向け小説と児童向け小説のカテゴリーは継続的に増加した。1982年には両方とも1/5(20%)であったが、1992年には前者は1/4(25%)に増加し、後者は2%増加した。1982年から2002年の間に、成人向け小説の売り上げは倍以上の45%に、児童向け小説は5%増加し、2002年にはこれら2つのジャンルの小計の割合は70%となった。
Biography, which took the same proportion as the aforementioned two categories in 1982, lost popularity from 20% in 1982 to 15% in 1992 and to only 8%, the lowest proportion, in 2002. Also, the ‘others’ category declined from 25% to less than half at 12% over the period with the percentage standing at one fifth in 1992. With regards to travel, starting from 15%, it saw a slight rise of 3% from 1982 to 1992, while the proportion had dipped to 10% by 2002.
1982年に前述の2つのカテゴリーと同じ割合を占めていた伝記は、1982年の20%から1992年には15%に減少し、2002年には最も低い8%になった。また、「その他」のカテゴリーは25%から半分以下の12%に減少し、1992年の割合は1/5(20%)であった。旅行に関しては、15%から始まり、1982年から1992年には3%とわずかに増加したが、2002年には10%に減少した。
IELTSライティングTask 1対策|基礎サンプル:スタティック
ライティングTask 1|基礎サンプル4:スタティック表
The table below shows weekly consumption by age group of dairy products in a European country.
Summarise the information by selecting and reporting the main features, and make comparisons where relevant.
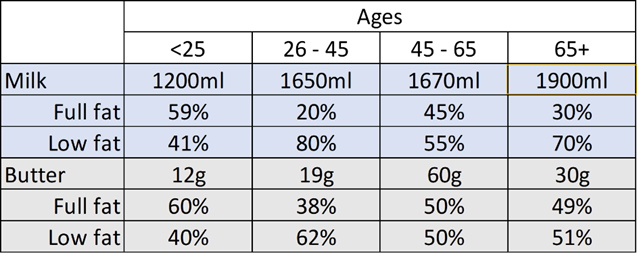
ボディ1とボディ2への分け方
- ボディ1: Milkの消費量の年代別の比較
- ボディ2: Butterの消費量の年代別の比較
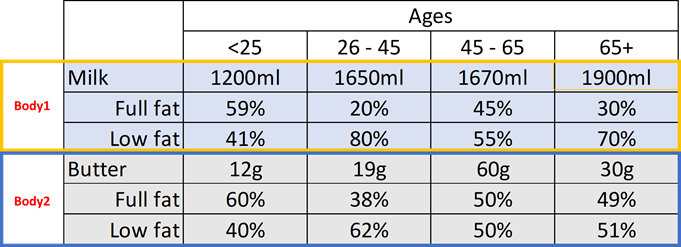
特徴の捉え方
ボディ1:Milkの消費量の年代別の比較
- 消費量:65歳以上が最も多い/25歳以下が最も少ない/26-45歳と45-65歳はほぼ同じ(1660前後)
- Low fat / Full fat:26歳以上(26-45、45-65、65 over)はLow fatを好み、25歳以下はFull fatを好む傾向
ボディ2:Butterの消費量の年代別の比較
- 消費量:45-65歳が60gで一番多い。65歳以上の2倍、25歳以下の5倍
- Low fatとFull fatの比率は、25歳以下:60%対40%、26-45歳:38% 対62%、その他(45-65歳、65歳以上)はほぼ同じ(50%対50%)
イントロダクション
パラフレイズ
問題文)The table below shows weekly consumption of dairy products by age group in a European country.
パラフレイズ)The table illustrates the amount of milk and butter consumed per week as well as the ratio of people who prefer full fat products to those who like low fat ones across four age groups in one European country.
表はヨーロッパのある国の4つの年齢層別の週あたりの牛乳とバターの消費量と、低脂肪製品を好む人と全脂肪製品を好む人の割合を示している。
問題文に触れられていなくてもボディパラグラフに入れる場合にはParaphraseにプラスして具体化する。
Overall
- Milk(主にlow fat)の消費量65以上グループが最大、Butterの消費量45-65歳グループが最大
- 25歳以下グループのグループはMilkもButterも消費量が最も低がfull fatの割合は最も大きい
Overall, the oldest group drinks milk the most, mainly low fat, and the 45-65 range group eat butter the most, whereas the youngest group consumes both milk and butter the least.
全体的には、最も高齢のグループが低脂肪を中心に牛乳を最も多く飲み、45-65歳のグループがバターを最も多く食べるのに対し、最も若いグループは牛乳とバターの両方を最も少ない。
ボディ
ボディ 1:Milkの消費量の年代別の比較
- 消費量:
- 65歳以上グループが最も多い(1900ml)
- 25歳以下グループが最も少ない(1200ml)
- 26-45歳グループと45-65歳グループはほぼ同じ(1660ml前後)
With regards to milk consumption, people in the oldest age group (over 65) drink the most at 1900ml, whereas those in youngest group (under 25) the least at 1200ml. The consumption by the 26-45 age group is almost as much as by the 45-65 age group at around 1660ml.
牛乳の消費量に関しては、最も高齢のグループ (65歳以上) が1900mlで最も多く、最も若いグループ (25歳未満) が1200mlで最も少ない。26-45歳のグループの消費量は1660mlで、45-65歳のグループとほぼ同じである。
- Low fat / Full fat:
- 26歳以上グループ(26-45、45-65、65 over)はLow fatを好む
- 25歳以下グループはFull fatを好む傾向
More people over 26 years old prefer low fat milk than full fat milk, whereas this trend is opposite for those under 26.
26歳以上では全脂肪乳よりも低脂肪乳を好む人が多く、26歳未満では逆の傾向にある。
ボディ 2:Butterの消費量の年代別の比較
- 消費量:
- 45-65歳グループが60gで一番多い
- (45-65歳の消費量は)65歳以上グループの2倍、25歳以下グループの5倍
The amount of butter eaten by those in the 45-65 age group stands at 60g, which is the largest for all age groups and is five times as much as that consumed by those under 25s.
45-65歳のバターの摂取量は60gで、全年齢層で最も多く、25歳未満の消費量の5倍である。
- Full fatとLow fatの比率:
- 25歳以下グループ:60%対40%
- 26-45歳グループ:38% 対62%
- その他(45-65歳グループ、65歳以上グループ)はほぼ同じ(50%対50%)
The ratio of their preference of full fat butter to low fat one is 60% to 40% for the youngest group and 38% to 62% for 26-45-year-old bracket, while this ratio is almost equal for the remaining two age groups.
低脂肪乳よりも全脂肪乳を好む割合は、最も若い層では60%:40%、26-45歳では38%:62%であり、残りの2つの年齢層ではこの割合はほぼ同じ(ほぼ50%:50%)である。
全体
The table illustrates the amount of milk and butter consumed per week as well as the ratio of people who prefer full fat products to those who like low fat ones across four age groups in one European country. Overall, the oldest group drinks milk the most, mainly low fat, and the 45-65 range group eat butter the most, whereas the youngest group consumes both milk and butter the least.
表はヨーロッパのある国の4つの年齢層別の週あたりの牛乳とバターの消費量と、低脂肪製品を好む人と全脂肪製品を好む人の割合を示している。全体的には、最も高齢のグループが低脂肪を中心に牛乳を最も多く飲み、45-65歳のグループがバターを最も多く食べるのに対し、最も若いグループは牛乳とバターの両方を最も少ない。
With regards to milk consumption, people in the oldest age group (over 65) drink the most at 1900ml, whereas those in youngest group (under 25) the least at 1200ml. The consumption by the 26-45 age group is almost as much as by the 45-65 age group at around 1660ml. More people over 26 years old prefer low fat milk than full fat milk, whereas this trend is opposite for those under 26.
牛乳の消費量に関しては、最も高齢のグループ (65歳以上) が1900mlで最も多く、最も若いグループ (25歳未満) が1200mlで最も少ない。26-45歳のグループの消費量は1660mlで、45-65歳のグループとほぼ同じである。26歳以上では全脂肪乳よりも低脂肪乳を好む人が多く、26歳未満では逆の傾向にある。
The amount of butter eaten by those in the 45-65 age group stands at 60g, which is the largest for all age groups and is five times as much as that consumed by those under 25s. The ratio of their preference of full fat butter to low fat one is 60% to 40% for the youngest group and 38% to 62% for 26-45-year-old bracket, while this ratio is almost equal for the remaining two age groups.
45-65歳のバターの摂取量は60gで、全年齢層で最も多く、25歳未満の消費量の5倍である。低脂肪乳よりも全脂肪乳を好む割合は、最も若い層では60%:40%、26-45歳では38%:62%であり、残りの2つの年齢層ではこの割合はほぼ同じである。
ライティングTask 1|基礎サンプル5:スタティック円グラフ&棒グラフ
The charts show the total usage proportions for water in Canada and a breakdown of its residential purposes.
Summarise the information by selecting and reporting the main features, and make comparisons where relevant.
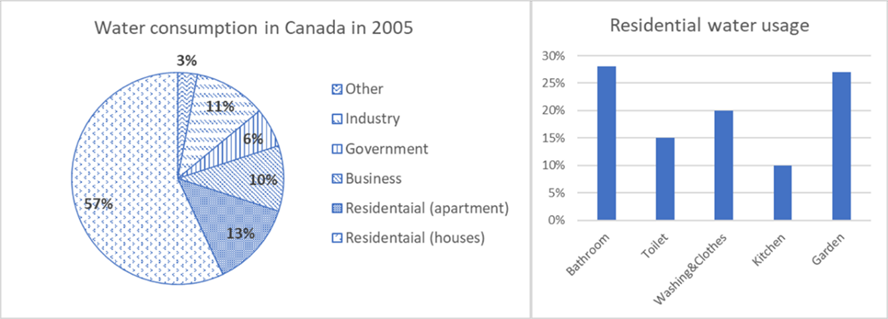
ボディ1とボディ2への分け方
特徴の捉え方
棒グラフは円ブラフのResidential (apartmentとhouses)の内訳なので特に棒グラフと円グラフを比較するようなことはなく、Body 1に円グラフ、Body 2に棒グラフとする。
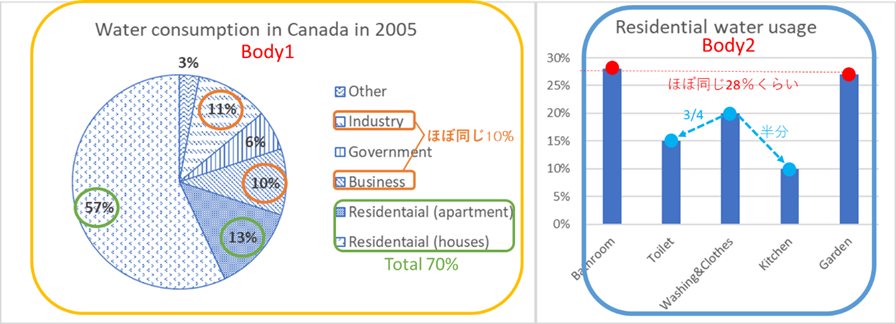
ボディ1:円グラフの説明
- Residential (houses 57% + apartment 13%)が合計で70%
- Industries(11%)とBusiness(10%)はほぼ同じくらい
- GovernmentとOtherはそれぞれ6%と3%
ボディ2:棒グラフの説明
- 主に使用されているのはbathroomsとgardensでそれぞれ28%くらい
- Residentsは15%、Toilets and kitchenは10%で、washing clothes(20%)と比べるとResidents は3/4(15%/20%)、Toilets and kitchen(10%/20%)は半分。
イントロダクション
パラフレイズ
問題文)The charts show the total usage proportions for water in Canada and a breakdown of its residential purposes.
パラフレイズ)The pie chart compares the proportion of water consumption across six different categories and the bar chart illustrates the purpose of the water use in residences by percentage, both of which come from data in Canada in 2005.
円グラフは6つの異なるカテゴリーにおける水の使用量の割合を比較し、棒グラフは住居での水の使用目的を割合で示している。どちらも2005年のカナダのデータに基づいている。
Overall
- Housesの消費が最大
- Residences(apartmentとhouses)ではbathroomとgardensに主に使用されている
Overall, water consumption in houses accounted for the largest proportion. In residences, the water was used mainly for bathrooms and gardens.
全体的には住居での水の使用量が最も大きな割合を占めている。住居では、水は主に浴室と庭に使用されている。
ボディ
ボディ 1:円グラフの説明
- Residential (houses 57% + apartment 13%)が合計で70%
According to the pie chart, the water consumption in residences, namely apartments and houses, made up a 70% share in total, with apartments and houses standing at 57% and 13%, respectively.
円グラフによると、住居、すなわちアパートと一軒家での水の使用量は全体の70%を占め、アパートと一軒家はそれぞれ57%と13%であった。
- Industries(11%)とBusiness(10%)はほぼ同じくらい
Following these two categories, industries consumed almost as much water as businesses, with the former at 11% and the latter at 10%.
この2つのカテゴリーに続いて、工業(Industry)と商業(Business)がほぼ同じ量の水を使用しており、前者は11%、後者は10%であった。
- GovernmentとOtherはそれぞれ6%と3%
The use in governmental bodies represented 6% and the other sector used half of that amount.
行政機関(Government)での使用量は6%であり、その他の部門での使用量はその半分であった。
ボディ 2:棒グラフの説明
- 主に使用されているのはbathroomsとgardensでそれぞれ28%くらい
Turning to the bar chart, the main purpose of the water consumption in residences was for bathrooms and gardens at approximately 28% each, meaning that the majority of water was used for these two purposes.
棒グラフに目を向けると、住居での主な水の使用目的は浴室と庭でそれぞれ約28%であり、大部分の水がこの2つの目的に使用されていることがわかる。
- Residentsは15%、Toilets and kitchenは10%で、washing clothes(20%)と比べるとResidents は3/4(15%/20%)、Toilets and kitchen(10%/20%)は半分。
Residents used 15% and 10% of water for toilets and kitchens, respectively, which was three-quarters and half of the amount for washing clothes (20%), respectively.
住居ではトイレと台所にそれぞれ15%と10%の水を使用しており、洗濯 (20%) と比べるてそれぞれ3/4(=15%)と半分(=10%)であった。
全体
The pie chart compares the proportion of water consumption across six different categories and the bar chart illustrates the purpose of the water use in residences by percentage, both of which come from data in Canada in 2005. Overall, water consumption in houses accounted for the largest proportion. In residences, the water was used mainly for bathrooms and gardens.
円グラフは6つの異なるカテゴリーにおける水の使用量の割合を比較し、棒グラフは住居での水の使用目的を割合で示している。どちらも2005年のカナダのデータに基づいている。全体的には住居での水の使用量が最も大きな割合を占めている。住居では、水は主に浴室と庭に使用されている。
According to the pie chart, the water consumption in residences, namely apartments and houses, made up a 70% share in total, with apartments and houses standing at 57% and 13%, respectively. Following these two categories, industries consumed almost as much water as businesses, with the former at 11% and the latter at 10%. The use in governmental bodies represented 6% and the other sector used half of that amount.
円グラフによると、住居、すなわちアパートと一軒家での水の使用量は全体の70%を占め、アパートと一軒家はそれぞれ57%と13%であった。この2つのカテゴリーに続いて、工業(Industry)と商業(Business)がほぼ同じ量の水を使用しており、前者は11%、後者は10%であった。行政機関(Government)での使用量は6%であり、その他の部門での使用量はその半分であった。
Turning to the bar chart, the main purpose of the water consumption in residences was for bathrooms and gardens at approximately 28% each, meaning that the majority of water was used for these two purposes. Residents used 15% and 10% of water for toilets and kitchens, respectively, which was three-quarters and half of the amount for washing clothes (20%), respectively.
棒グラフに目を向けると、住居での主な水の使用目的は浴室と庭でそれぞれ約28%であり、大部分の水がこの2つの目的に使用されていることがわかる。住居ではトイレと台所にそれぞれ15%と10%の水を使用しており、洗濯 (20%) と比べるてそれぞれ3/4(=15%)と半分(=10%)であった。
IELTSライティングTask 1対策|基礎サンプル:地図
ライティングTask 1|基礎サンプル6:地図
The following diagrams show the present and planned developments in the biomedical campus of a university.
Summarise the information by selecting and reporting the main features, and make comparisons where relevant.

ボディ1とボディ2への分け方
- ボディ1:roads and the walkwayの変化
- ボディ2:施設の変化
特徴の捉え方
ボディ1:roads and the walkwayの変化
- Walkwayは変わらない
- 左側から下って右側へ通りぬけるRoadはなくなる
- 左側のRoadは下まで延長され下側にも新しくRoadができる
- 下側のRoadと左側のRoadは途中で繋がり三角形の道ができる
ボディ2:施設の変化
- 緑地にGeneticsとBio-imagingのビルを追加
- Biochemistryのビルは鋭角のL字型のビルに拡大
- Car parkingはStudent向けのCar parkingに変更
- GeneticのビルはGenetic 2へ変更
- Biotechのビルは隣にもう一つできて繋がる
イントロダクション
パラフレイズ
問題文)The following diagrams show the present and planned developments in the biomedical campus of a university.
パラフレイズ)The two maps illustrate the existing arrangement and projected changes of a biomedical campus.
2つの地図は、バイオメディカルキャンパスの現在の配置と予定されている変更を示している。
Overall
- いくつかの設備が追加される
- 緑地は減る
- 道路の配置も変更
- laboratoriesとwalkwayは変わらない
Overall, some facilities are expected to be added by cutting trees down and relocating roads, while the locations of the laboratories and the walkway will remain unchanged.
全体として、いくつかの施設は木々の伐採と道路の移転によって追加される予定であるが、研究室と歩道の位置は変更されない。
ボディ
ボディ 1:roads and the walkwayの変化
- Walkwayは変える予定はない
- 左側から下って右側へ通りぬけるRoadは、左側部分は下まで延長され、右側へ通りぬける部分はキャンパスの下側へ移る
As for the roads and the walkway, the existing walkway will stay the same but the road, which runs down the left side of the campus then through the full width to the right side, is planned to be extended to run along the whole left side of the campus and the other road will be moved to the bottom of the site.
道路と歩道は、既存のものは変更されないが、キャンパスの左側を通って右側に全幅を通る道路はキャンパスの左側に沿って延長され、他の道路は敷地の下部に移動される予定である。
- 下側のRoadと左側のRoadは途中で繋がり三角形の道ができる
Furthermore, this newly added road on the left side and the one at the bottom of the map will be connected by a through road, making a triangular-shaped area surrounded by the roads, which will be used as a staff car park.
さらに、新たに追加された左側の道路と地図の下部の道路は貫通道路で接続され、道路に囲まれた三角形の領域が形成され、職員駐車場として使用される。
ボディ 2:施設の変化
- 地図の左側
- 緑地にGeneticsとBio-imagingのビルを追加
- Bochemistryのビルは鋭角のL字型のビルに拡大
With regards to the facilities, on the top left side of the campus, buildings for genetics and bio-imaging will be added by removing greenery. Moreover, the existing building for biochemistry will be expanded and changed into an acute-angle L-shape along the walkway and the new road.
施設については、キャンパスの左上に、遺伝学とバイオイメージングのための建物が緑地を除去して追設される。また、既存のBiochemistry棟を拡張し、歩道と新道に沿って鋭角L字型に変更する。
- 地図の右側1
- Car parkingはStudent向けのCar parkingに変更
- GeneticのビルはGenetic 2へ変更
On the right side of the campus, the current car park will be exclusively for students and the name of the building for genetics is expected to be changed to “Genetics 2”.
キャンパスの右側には、現在の駐車場を学生専用にし、遺伝学棟の名称を“Genetics2”に変更する予定である。
- 地図の右側2
- Biotechのビルは隣にもう一つできて繋がる
A new building for biotech will be built next to the existing one and both will be connected.
既存の建物の隣に新しいBiotech棟を建設し、両者を連結する。
全体
The two maps illustrate the existing arrangement and projected changes of a biomedical campus. Overall, some facilities are expected to be added by cutting trees down and relocating roads, while the locations of the laboratories and the walkway will remain unchanged.
2つの地図は、バイオメディカルキャンパスの現在の配置と予定されている変更を示している。全体として、いくつかの施設は木々の伐採と道路の移転によって追加される予定であるが、研究室と歩道の位置は変更されない。
As for the roads and the walkway, the existing walkway will stay the same but the road, which runs down the left side of the campus then through the full width to the right side, is planned to be extended to run along the whole left side of the campus and the other road will be moved to the bottom of the site. Furthermore, this newly added road on the left side and the one at the bottom of the map will be connected by a through road, making a triangular-shaped area surrounded by the roads, which will be used as a staff car park.
道路と歩道は、既存のものは変更されないが、キャンパスの左側を通って右側に全幅を通る道路はキャンパスの左側に沿って延長され、他の道路は敷地の下部に移動される予定である。さらに、新たに追加された左側の道路と地図の下部の道路は貫通道路で接続され、道路に囲まれた三角形の領域が形成され、職員駐車場として使用される。
With regards to the facilities, on the top left side of the campus, buildings for genetics and bio-imaging will be added by removing greenery. Moreover, the existing building for biochemistry will be expanded and changed into an acute-angle L-shape along the walkway and the new road. On the right side of the campus, the current car park will be exclusively for students and the name of the building for genetics is expected to be changed to “Genetics 2”. A new building for biotech will be built next to the existing one and both will be connected.
施設については、キャンパスの左上に、遺伝学とバイオイメージングのための建物が緑地を除去して追設される。また、既存のBiochemistry棟を拡張し、歩道と新道に沿って鋭角L字型に変更する。キャンパスの右側には、現在の駐車場を学生専用にし、遺伝学棟の名称を“Genetics2”に変更する予定である。既存の建物の隣に新しいBiotech棟を建設し、両者を連結する。
IELTSライティングTask 1対策|基礎サンプル:プロセス
ライティングTask 1|基礎サンプル7:プロセス
The diagram below shows the process for recycling plastic bottles.
Summarise the information by selecting and reporting the main features and make comparisons where relevant.
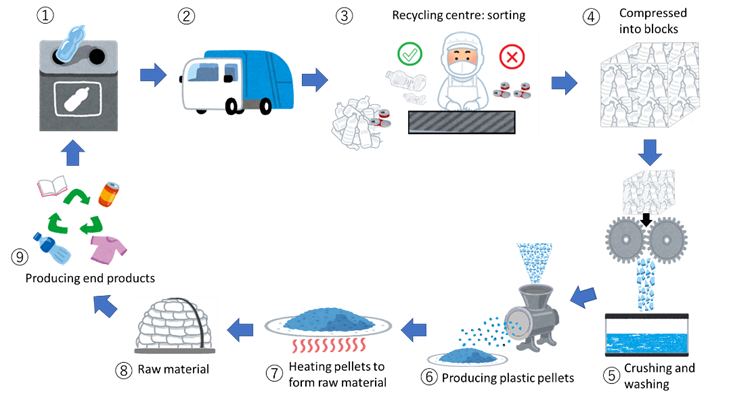
ボディ1とボディ2への分け方
- ボディ1:プロセスの前半(①~④)
- ボディ2:プロセスの後半(⑤~⑨)
特徴の捉え方
一つ一つの流れを大まかに書く(あまり細かく書く必要はない)
イントロダクション
パラフレイズ
問題文)The diagram below shows the process for recycling plastic bottles.
パラフレイズ)The diagram illustrates how plastic bottles are recycled.
図は、ペットボトルがどのようにリサイクルされるかを示している。
Overall
ボトルの回収からリサイクル製品の製造までの手作業/機械作業の9段階のプロセス
Overall, it is a circular process containing nine stages with both manual and mechanised processes starting from collecting used bottles to making recycled products.
全体的には、使用済みペットボトルの回収からリサイクル製品の製造まで、手作業と機械化されたプロセスの両方を含む9つの段階からなる循環プロセスである。
ボディ
ボディ 1:プロセスの前半(①~④)
①To start with, used plastic bottles are collected in a designated container and ②a garbage truck carries the collected bottles to a recycling centre. There, ③staff working for the centre pick out the bottles manually in order to sort them into the recyclables and non-recyclables. After that, ④the vast number of recyclable bottles are compressed into a cubic block.
①まず、使用済みペットボトルは指定された容器に集められ、②収集されたペットボトルはゴミ収集車によってリサイクルセンターに運ばれる。そこで、③センターのスタッフが手作業でペットボトルを取り出し、リサイクル可能なものとそうでないものに分別する。その後、④大量のリサイクル可能なペットボトルは立方体のブロックに圧縮される。
ボディ 2:プロセスの後半(⑤~⑨)
Next, ⑤the compressed blocks of bottles are crushed into small pieces by sharp, circular rollers, and then the crushed pieces are dropped into a container filled with liquid to be washed. Then, ⑥the small pieces of washed plastics are converted into pellets by a machine. ⑦The pellets are then heated until they melt and ⑧form raw materials from which ⑨some products, such as plastic containers, T-shirts, pencils as well as plastic bags, are made. ①Some of these products are then throw away into the recycling and the process starts again.
circular processなので①に戻ることを最後に追加した。
次に、⑤圧縮されたボトルの塊を鋭利な円形のローラーで細かく砕き、それを液体の入った容器に落として洗浄する。その後、⑥洗浄されたプラスチックの破片は機械でペレットに変換される。⑦ペレットはその後、溶けるまで加熱され、⑧⑨プラスチック容器、Tシャツ、鉛筆、ビニール袋などの製品を製造する原料となる。①これらの製品の一部はその後リサイクルのために捨てられ、プロセスが同じ再び始まる。
全体
The diagram illustrates how plastic bottles are recycled. Overall, it is a circular process containing nine stages with both manual and mechanised processes starting from collecting used bottles to making recycled products.
図は、ペットボトルがどのようにリサイクルされるかを示している。全体的には、使用済みペットボトルの回収からリサイクル製品の製造まで、手作業と機械化されたプロセスの両方を含む9つの段階からなる循環プロセスである。
To start with, used plastic bottles are collected in a designated container and a garbage truck carries the collected bottles to a recycling centre. There, staff working for the centre pick out the bottles manually in order to sort them into the recyclables and non-recyclables. After that, the vast number of recyclable bottles are compressed into a cubic block.
まず、使用済みペットボトルは指定された容器に集められ、収集されたペットボトルはゴミ収集車によってリサイクルセンターに運ばれる。そこで、センターのスタッフが手作業でペットボトルを取り出し、リサイクル可能なものとそうでないものに分別する。その後、大量のリサイクル可能なペットボトルは立方体のブロックに圧縮される。
Next, the compressed blocks of bottles are crushed into small pieces by sharp, circular rollers, and then the crushed pieces are dropped into a container filled with liquid to be washed. Then, the small pieces of washed plastics are converted into pellets by a machine. The pellets are then heated until they melt and form raw materials from which some products, such as plastic containers, T-shirts, pencils as well as plastic bags, are made. Some of these products are then throw away into the recycling and the process starts again.
次に、圧縮されたボトルの塊を鋭利な円形のローラーで細かく砕き、それを液体の入った容器に落として洗浄する。その後、洗浄されたプラスチックの破片は機械でペレットに変換される。ペレットはその後、溶けるまで加熱され、プラスチック容器、Tシャツ、鉛筆、ビニール袋などの製品を製造する原料となる。これらの製品の一部はその後リサイクルのために捨てられ、プロセスが同じ再び始まる。
IELTSライティングTask 1対策|実践問題20
IELTS Writing Task 1には出題形式でご紹介したように次の10パターンがあります。この10パターンで自分の回答を作ってベースにしてください。10パターンのベースができればそれを応用して変えれば多くの問題に対応できます。
ここでは10パターンにそれぞれ2つずつ問題とサンプル回答、ポイント解説をご紹介します。是非自分の作った回答と照らし合わせて、表現や書き方の参考にしてください。
ダイナック棒グラフ その1
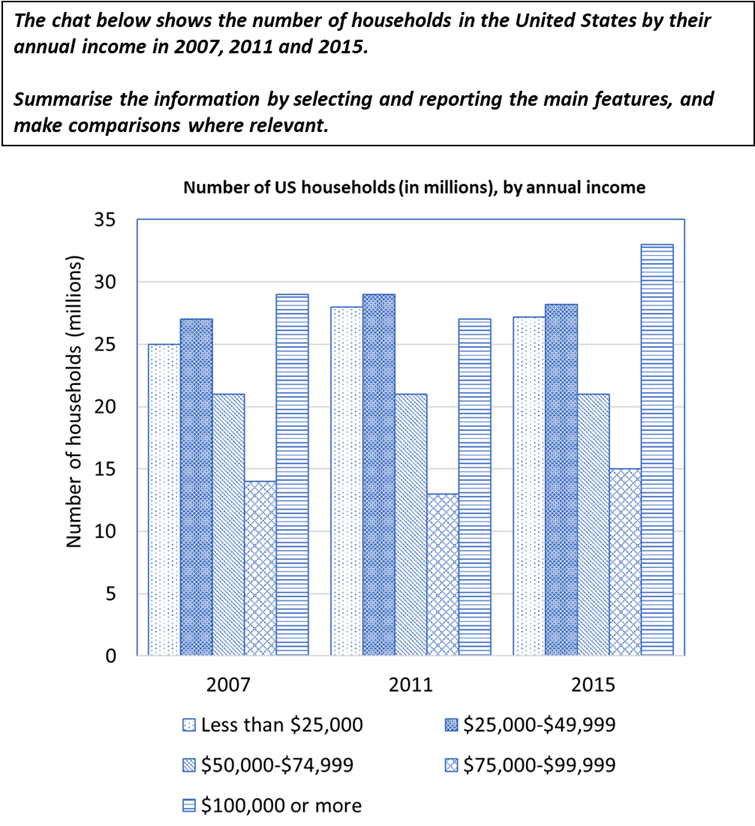
サンプル回答&ポイント解説
サンプル回答
The bar chart illustrates the total number of families in the United States categorised by average annual income from 2007 to 2015. Overall, over the eight-year period, all income groups witnessed rising trends except those falling in the middle-income group, which remained almost stable. The greatest increase as well as the highest proportion by the end of the period were observed among the highest earners.
棒グラフは、2007年から2015年までの米国の平均年収別世帯数を示している。全体的には、ほぼ安定していた中所得層を除いて、すべての所得層で増加傾向が見られた。期間の終わりまでに最大の増加と最も高い割合が見られたのは、高所得者層であった。
In 2007, families with annual incomes under $25,000 numbered 25 million, a figure considerably higher than the ones earning $50,000-$74,999 (21 million) and $75,000-99,999 (14 million) but lower than those earning $25,000-$49,999 (27 million) and the ones earning over $100,000 (29 million). Four years later, the numbers of the wealthiest and the second-highest income households exhibited declining trend of a few million, whereas the lowest and the second-lowest earning bracket families underwent rises of approximately three and two millions, respectively.
2007年には、年収25,000ドル未満の世帯は2500万世帯となり、50,000-74,999ドルの世帯 (2100万世帯) と75,000-99,999ドルの世帯 (1400万世帯) よりはかなり多いが、25,000-49,999ドルの世帯 (2700万世帯) と100,000ドル以上の世帯 (2900万世帯) よりは少ない。4年後には、最富裕層と2番目に高い所得層の世帯数は数百万の減少傾向を示したが、最低所得層と2番目に低い所得層の世帯数はそれぞれ約300万と約200万の増加を示した。
By 2015, the number of the richest households had risen sharply to around 33 million, while the two lowest-earning groups showed slightly declining trends of about one million each, ending at around 27 to 28 million. The second highest earning households experienced a moderate rise concluding the period at 15 million. During the entire period, only the middle-income group demonstrated unchanged figures that stood at approximately 21 million.
2015年までに、最富裕層の世帯数は約3300万世帯に急増したが、最低所得層と2番目に低い所得層の世帯数はそれぞれ約100万のわずかな減少傾向を示し、約2700-2800万世帯で終わった。2番目に所得の高い世帯は緩やかに上昇し、1500万世帯で終了した。全期間を通じて、中所得層のみが約2100万世帯で横ばいでした。
ポイント解説
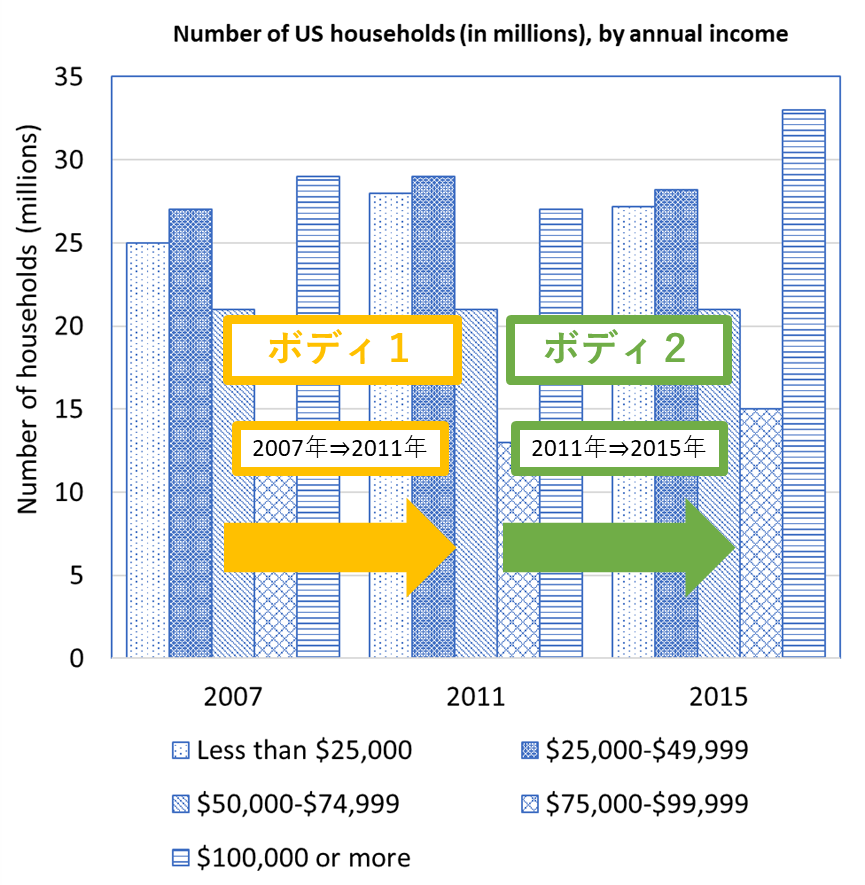
イントロダクション
1文目:問題文のパラフレイズ
- 問題文のパラフレイズについてはこちら
(問題文)The chat below shows the number of households in the United States by their annual income in 2007, 2011 and 2015.
⇓ ⇓ ⇓
(パラフレイズ)The bar chart illustrates the total number of families in the United States categorised by average annual income from 2007 to 2015.
棒グラフは、2007年から2015年までの米国の平均年収別世帯数を示している。
2文目:Overall
- Overallについてはこちら
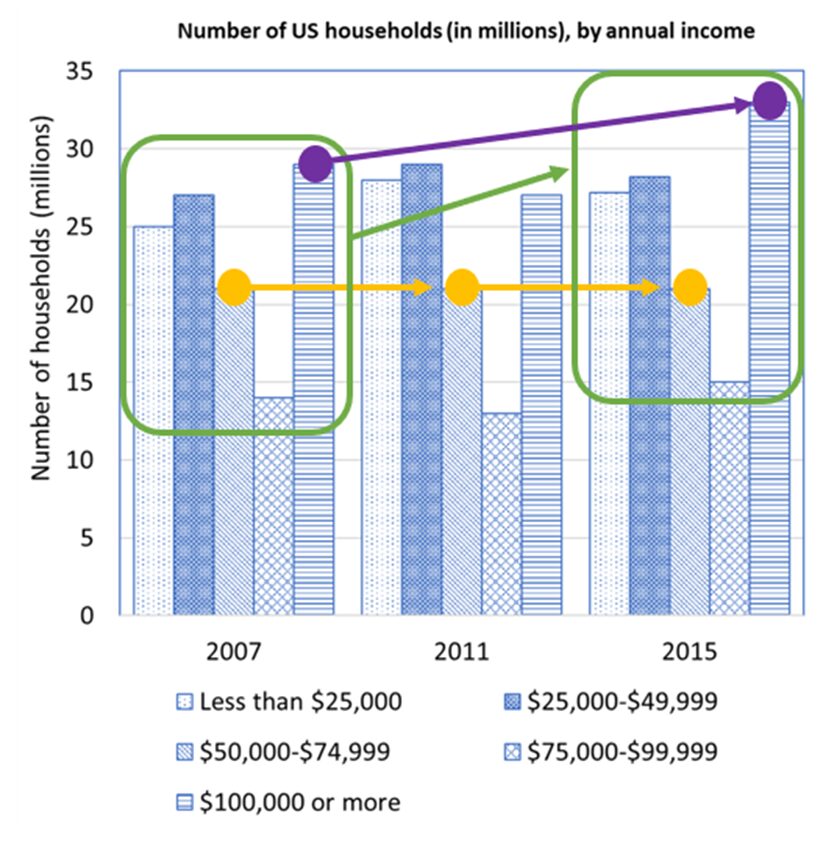
Overall 1文目
オレンジの中間層($50,000-$74,999)は一定で、この層を除いて2007年と2015年を比較すると全体的に収入は増えた(緑の枠)。
Overall, over the eight-year period, all income groups witnessed rising trends except those falling in the middle-income group, which remained almost stable.
全体的には、ほぼ安定していた中所得層を除いて、すべての所得層で増加傾向が見られた。
Overall 2文目
2007年と2015年で紫の高所得層は最も増えて、最も多くの世帯数だった。
The greatest increase as well as the highest proportion by the end of the period were observed among the highest earners.
期間の終わりまでに最大の増加と最も高い割合が見られたのは、高所得者層であった。
イントロダクションパラグラフ全体
The bar chart illustrates the total number of families in the United States categorised by average annual income from 2007 to 2015. Overall, over the eight-year period, all income groups witnessed rising trends except those falling in the middle-income group, which remained almost stable. The greatest increase as well as the highest proportion by the end of the period were observed among the highest earners.
棒グラフは、2007年から2015年までの米国の平均年収別世帯数を示している。全体的には、ほぼ安定していた中所得層を除いて、すべての所得層で増加傾向が見られた。期間の終わりまでに最大の増加と最も高い割合が見られたのは、高所得者層であった。
ボディ1
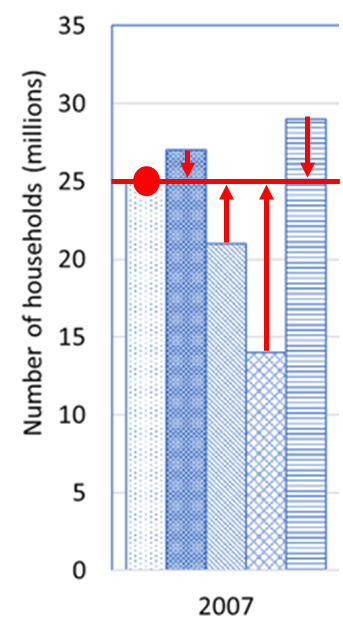
ボディ1 1文目
まずは2011年、2015年と比較をするために2007年の状況を書きました。ここではLess than $25,000 (25 millions)の層が他の層と比べて真ん中にあったので、この層を基準にして、$50,000-$74,999 (21 million) と$75,000-99,999 (14 million) より多く、$25,000-$49,999 (27 million)と$100,000 (29 million) or overよりも少なかった。
In 2007, families with annual incomes under $25,000 numbered 25 million, a figure considerably higher than the ones earning $50,000-$74,999 (21 million) and $75,000-99,999 (14 million) but lower than those earning $25,000-$49,999 (27 million) and the ones earning over $100,000 (29 million).
2007年には、年収25,000ドル未満の世帯は2500万世帯となり、50,000-74,999ドルの世帯 (2100万世帯) と75,000-99,999ドルの世帯 (1400万世帯) よりはかなり多いが、25,000-49,999ドルの世帯 (2700万世帯) と100,000ドル以上の世帯 (2900万世帯) よりは少ない。
ポイント
- 問題文のhouseholdが使われているのでfamiliesにパラフレイズ、グラフ下の凡例にはLess than $25,000と$100,000 (29 million) or overと書かれているのでこれらもunder $25,000とover $100,000にパラフレイズしました。
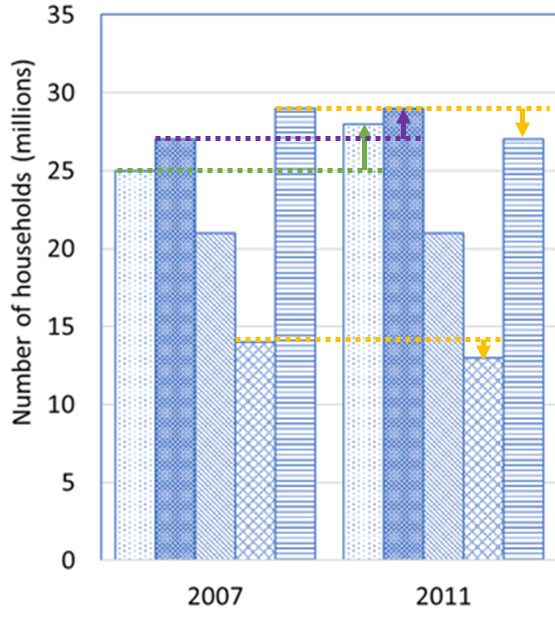
ボディ1 2文目
2007年と2011年を比較して、1番富裕層と2番目に富裕層の層は数million減少したが(オレンジ)、1番貧しい層はだいたい3million増加(緑)し2番目に貧しい層はだいたい2million増加(紫)した。
Four years later, the numbers of the wealthiest and the second-highest income households exhibited declining trend of a few million, whereas the lowest and the second-lowest earning bracket families underwent rises of approximately three and two millions, respectively.
4年後には、最富裕層と2番目に高い所得層の世帯数は数百万の減少傾向を示したが、最低所得層と2番目に低い所得層の世帯数はそれぞれ約300万と約200万の増加を示した。
ポイント
- 2007年を1文目で基準にしているので2011は4年後(Four years later)と表現しました。
- 1番富裕層はthe wealthiestとしてあえて2番目に富裕層はthe second-highest incomeとパラフレイズしました(the lowest / the second-lowestはあえて同じlowを使ってみました)。
- 減った傾向を表すのにexhibited declining trendを使ったので増えた傾向はただdecliningをincreasingにするのではなくunderwent risesに変えました。
- whereasを使って比較をしました。比較表現についてはこちら
ボディ1全体
In 2007, families with annual incomes under $25,000 numbered 25 million, a figure considerably higher than the ones earning $50,000-$74,999 (21 million) and $75,000-99,999 (14 million) but lower than those earning $25,000-$49,999 (27 million) and the ones earning over $100,000 (29 million). Four years later, the numbers of the wealthiest and the second-highest income households exhibited declining trend of a few million, whereas the lowest and the second-lowest earning bracket families underwent rises of approximately three and two millions, respectively.
2007年には、年収25,000ドル未満の世帯は2500万世帯となり、50,000-74,999ドルの世帯 (2100万世帯) と75,000-99,999ドルの世帯 (1400万世帯) よりはかなり多いが、25,000-49,999ドルの世帯 (2700万世帯) と100,000ドル以上の世帯 (2900万世帯) よりは少ない。4年後には、最富裕層と2番目に高い所得層の世帯数は数百万の減少傾向を示したが、最低所得層と2番目に低い所得層の世帯数はそれぞれ約300万と約200万の増加を示した。
ボディ2
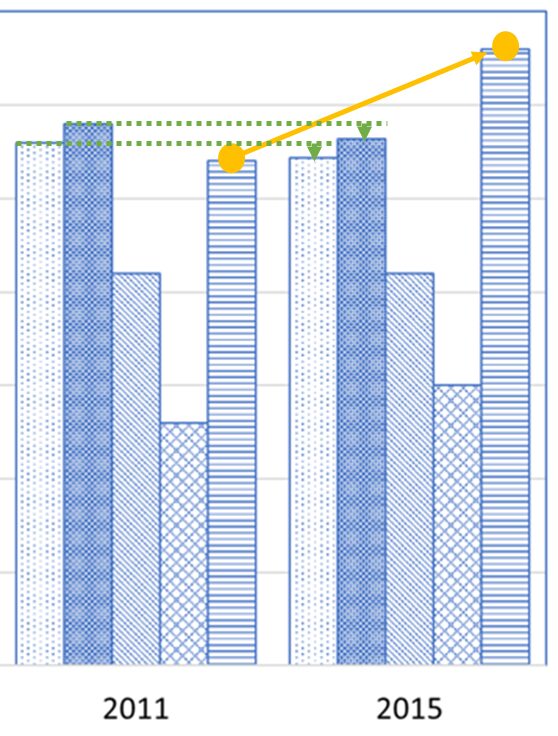
ボディ2 1文目
ボディ1で2007年から2011年までの変化を書いたのでボディ2では2011年から2015年までの変化を書きます。
一番変動が大きいのが1番所得の多い層で33millionにまで上がって(オレンジ)、一方で低所得層の2つの層の数はだいたい1million下がって27-28millionになっています(緑)ので増えた層と減った層をwhileで対比させた。
By 2015, the number of the richest households had risen sharply to around 33 million, while the two lowest-earning groups showed slightly declining trends of about one million each, ending at around 27 to 28 million.
2015年までに、最富裕層の世帯数は約3300万世帯に急増したが、最低所得層と2番目に低い所得層の世帯数はそれぞれ約100万のわずかな減少傾向を示し、約2700-2800万世帯で終わった。
ポイント
ボディ2 2文目
2番目に所得の高い世帯層は若干増えて2015年は15millionだった(オレンジ)。
The second highest earning households experienced a moderate rise concluding the period at 15 million.
2番目に所得の高い世帯は緩やかに上昇し、1500万世帯で終了した。
ポイント
- 数が増えたことをイントロダクションではwitnessed rising trends、ボディ1ではunderwent rises、ボディ2の1文目ではrisen sharplyを使ったのでここではexperienced a moderate riseにパラフレイズしました。
- 分詞構文(concluding)を使って数字を表現しました。数字の表現についてはこちら
ボディ2 3文目
イントロダクションパラグラフでも書いた通り真ん中の層の数は2007-2011-2015で21millionで変わらなかった。
During the entire period, only the middle-income group demonstrated unchanged figures that stood at approximately 21 million.
全期間を通じて、中所得層のみが約2100万世帯で横ばいでした。
ポイント
- 数が同じだったことをイントロダクションではremained almost stableと書いたのでここではdemonstrated unchanged figuresとパラグラフしました。
- stood atなど数字を表す表現はこちら
ボディ2全体
By 2015, the number of the richest households had risen sharply to around 33 million, while the two lowest-earning groups showed slightly declining trends of about one million each, ending at around 27 to 28 million. The second highest earning households experienced a moderate rise concluding the period at 15 million. During the entire period, only the middle-income group demonstrated unchanged figures that stood at approximately 21 million.
2015年までに、最富裕層の世帯数は約3300万世帯に急増したが、最低所得層と2番目に低い所得層の世帯数はそれぞれ約100万のわずかな減少傾向を示し、約2700-2800万世帯で終わった。2番目に所得の高い世帯は緩やかに上昇し、1500万世帯で終了した。全期間を通じて、中所得層のみが約2100万世帯で横ばいでした。
ダイナック棒グラフ その2
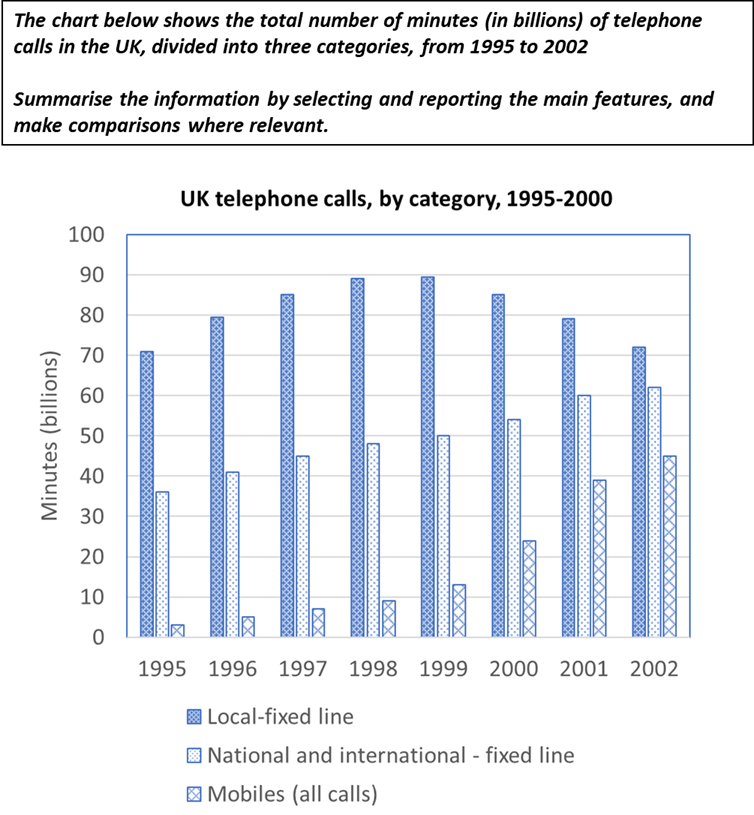
サンプル回答&ポイント解説
サンプル回答
The bar graph illustrates the total time spent in billions of minutes on three different kinds of phone calls in the United Kingdom between 1995 and 2002. Overall, local calls were the most popular over the whole period, followed by national and international calls, with mobile calls occupying the third place. Furthermore, the duration spent on national and international calls as well as mobile calls increased over the period, narrowing the gap between the three categories by 2002.
棒グラフは、1995年から2002年までの英国における3つの異なるタイプの通話に費やされた合計時間をbillion minutesで示しています。全体では、全期間を通じて市内通話(Local-fixed line)が最も人気があり、国内/国際通話(National and international-fixed line)がそれに続き、携帯電話(Mobiles)が3位を占めました。さらに、国内/国際通話、そして携帯電話の通話時間はこの期間を通じて増加し、2002年までに3つのカテゴリーの差を縮めました。
The time spent on local calls rose steadily from just over 70 billion minutes in 1995 until 1999 when it peaked at approximately 90 billion, before gradually decreasing to end the period at almost the same duration as in 1995.
市内通話(Local-fixed line)の通話時間は、1995年の70 billion minutes強から1999年の約90 billion minutesのピークまで増加し、その後徐々に減少して1995年とほぼ同じ時間数で終了しました。
National and international calls demonstrated consistent increase year on year, from just over 35 billion minutes to a peak of just above 60 billion minutes during the period. Mobile phone usage duration grew at a more rapid pace from approximately 3 billion minutes in 1995 to nearly 45 billion minutes in 2002. This figure exhibited dramatic patterns between 1999 and 2001 when it was more than tripled from about 12 billion minutes to nearly 40 billion minutes. The continuous growth of the former paired with the surge of the latter significantly closed the gap between the three types of phone calls by the end of the period in 2002.
国内/国際通話(National and international-fixed line)は、この期間の35 billion minutesから60 billion minutesのピークまで、毎年一貫して増加しました。携帯電話の通話時間は、1995年の約3 billion minutesから2002年には約45 billion minutesとより急速に増加しました。この数字は、1999年から2001年にかけて劇的な増加を示し、約12 billion minutesから約40 billion minutesへと3倍以上に増加しました。前者の継続的な成長と後者の急増は、2002年の期間末で3つのカテゴリーの差を大きく縮めました。
ポイント解説
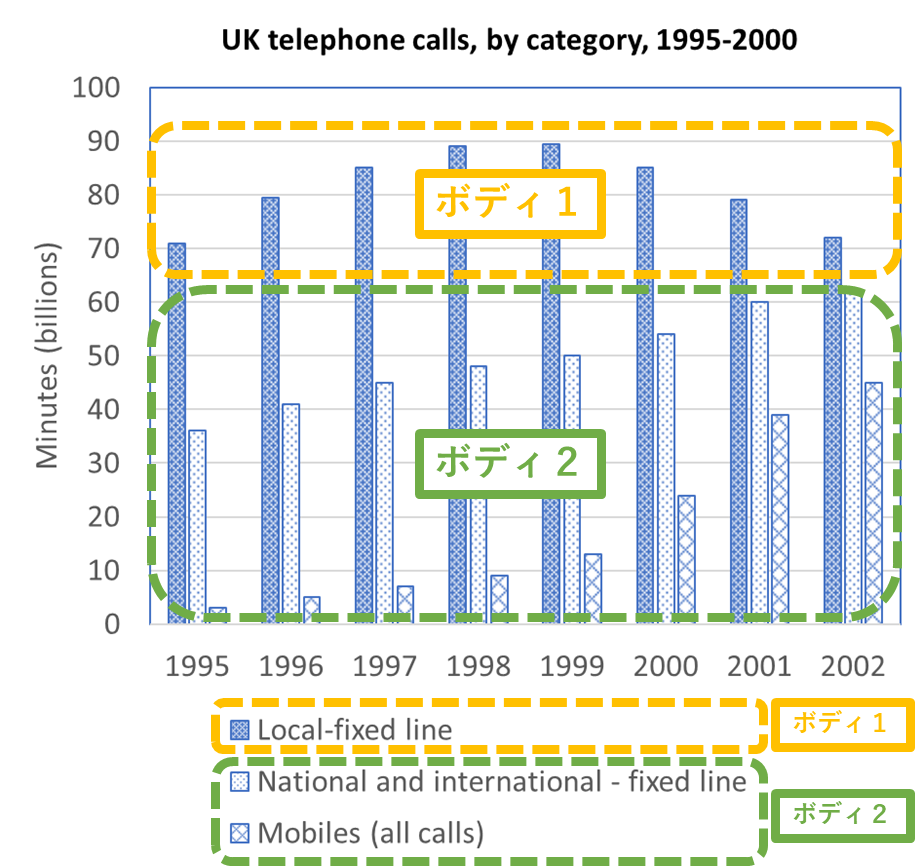
イントロダクション
1文目:問題文のパラフレイズ
- 問題文のパラフレイズについてはこちら
(問題文)The chart below shows the total number of minutes (in billions) of telephone calls in the UK, divided into three categories, from 1995 to 2002.
⇓ ⇓ ⇓
(パラフレイズ)The bar graph illustrates the total time spent in billions of minutes on three different kinds of phone calls in the United Kingdom between 1995 and 2002.
棒グラフは、1995年から2002年までの英国における3つの異なるタイプの通話に費やされた合計時間をbillion minutesで示しています。
2文目:Overall
- Overallについてはこちら
Overall 1文目
local callsは期間中常に1番多く、その次にnational and international calls、そして3番目がmobile callsだった。
Overall, local calls were the most popular over the whole period, followed by national and international calls, with mobile calls occupying the third place.
全体では、全期間を通じて市内通話(Local-fixed line)が最も人気があり、国内/国際通話(National and international-fixed line)がそれに続き、携帯電話(Mobiles)が3位を占めました。
ポイント
- 1番目(most)や2番、3番(third place)の表現についてはこちら
- 1番目、2番目、3番目の書き方(followed byなど)はこちら
- 付帯状況のwithを使って説明を追加しました。付帯状況のwithについてはこちら
Overall 2文目
2002年を見ると、national and international callsとmobile callsが増えたことによって3つのタイプのcallの差が少なくなっていた(オレンジ)。
Furthermore, the duration spent on national and international calls as well as mobile calls increased over the period, narrowing the gap between the three categories by 2002.
さらに、国内/国際通話、そして携帯電話の通話時間はこの期間を通じて増加し、2002年までに3つのカテゴリーの差を縮めました。
ポイント
- 分詞構文(narrowing)を使って説明を追加しました。分詞構文の表現についてはこちら
イントロダクションパラグラフ全体
The bar graph illustrates the total time spent in billions of minutes on three different kinds of phone calls in the United Kingdom between 1995 and 2002. Overall, local calls were the most popular over the whole period, followed by national and international calls, with mobile calls occupying the third place. Furthermore, the duration spent on national and international calls as well as mobile calls increased over the period, narrowing the gap between the three categories by 2002.
棒グラフは、1995年から2002年までの英国における3つの異なるタイプの通話に費やされた合計時間をbillion minutesで示しています。全体では、全期間を通じて市内通話(Local-fixed line)が最も人気があり、国内/国際通話(National and international-fixed line)がそれに続き、携帯電話(Mobiles)が3位を占めました。さらに、国内/国際通話、そして携帯電話の通話時間はこの期間を通じて増加し、2002年までに3つのカテゴリーの差を縮めました。
ボディ1
ボディ1 1文目
1995年に70 billionからスタートして徐々に上がって1995年にはピークの90 billionになり(オレンジ)、その後2002年まで減少し(緑)、2002年には1995年と同じくらい(70 billion)(紫)になった。
The time spent on local calls rose steadily from just over 70 billion minutes in 1995 until 1999 when it peaked at approximately 90 billion, before gradually decreasing to end the period at almost the same duration as in 1995.
市内通話(Local-fixed line)の通話時間は、1995年の70 billion minutes強から1999年の約90 billion minutesのピークまで増加し、その後徐々に減少して1995年とほぼ同じ時間数で終了しました。
ポイント
- 上がって下がっての表現はこちら
- 1995年⇒1999年(オレンジ)も1999年⇒2002年(緑)も徐々に上がって/下がってですが、同じ単語ではなくsteadilyとgraduallyにパラフレイズしました。どんな風に(増えた/減った)の表現はこちら
- when it peakedのようなその時何があったかをあらわす表現はこちら、最高値ピークに達する場合の表現はこちら
- 具体的な数字は読めないのでjust overやapproximatelyでだいたいの数字を書きました。だいたいの数字の表現はこちら
- 2002年に70 billionと書くのではなく1995年と同じくらい(at almost the same duration as in 1995)とパラフレイズしました。
ボディ1全体
The time spent on local calls rose steadily from just over 70 billion minutes in 1995 until 1999 when it peaked at approximately 90 billion, before gradually decreasing to end the period at almost the same duration as in 1995.
市内通話(Local-fixed line)の通話時間は、1995年の70 billion minutes強から1999年の約90 billion minutesのピークまで増加し、その後徐々に減少して1995年とほぼ同じ時間数で終了しました。
ボディ2
ボディ2 1文目
National and international callsについて1995年の35 billionから年々徐々に上がって2002年に60 billionに達した(オレンジ)。
National and international calls demonstrated consistent increase year on year, from just over 35 billion minutes to a peak of just above 60 billion minutes during the period.
国内/国際通話(National and international-fixed line)は、この期間の35 billion minutesから60 billion minutesのピークまで、毎年一貫して増加しました。
ポイント
ボディ2 2文目&3分目
Mobile phoneはNational and international callsよりも早いスピードで上がり1995年に3 billionだったのが2002年には45 billionになり(オレンジ)ったと書きました。また、続く文で特に1999年から2001年にかけては12 billionから40 billionに3倍以上になった(緑)。
Mobile phone usage duration grew at a more rapid pace from approximately 3 billion minutes in 1995 to nearly 45 billion minutes in 2002. This figure exhibited dramatic patterns between 1999 and 2001 when it was more than tripled from about 12 billion minutes to nearly 40 billion minutes.
携帯電話の通話時間は、1995年の約3 billion minutesから2002年には約45 billion minutesとより急速に増加しました。この数字は、1999年から2001年にかけて劇的な増加を示し、約12 billion minutesから約40 billion minutesへと3倍以上に増加しました。
ポイント

ボディ2 4文目
イントロダクションで書いたように、National and international callsとMobile phoneの増加により3つのタイプの差が少なくなった(オレンジ)。
The continuous growth of the former paired with the surge of the latter significantly closed the gap between the three types of phone calls by the end of the period in 2002.
前者の継続的な成長と後者の急増は、2002年の期間末で3つのカテゴリーの差を大きく縮めました。
ポイント
ボディ2全体
National and international calls demonstrated consistent increase year on year, from just over 35 billion minutes to a peak of just above 60 billion minutes during the period. Mobile phone usage duration grew at a more rapid pace from approximately 3 billion minutes in 1995 to nearly 45 billion minutes in 2002. This figure exhibited dramatic patterns between 1999 and 2001 when it was more than tripled from about 12 billion minutes to nearly 40 billion minutes. The continuous growth of the former paired with the surge of the latter significantly closed the gap between the three types of phone calls by the end of the period in 2002.
国内/国際通話(National and international-fixed line)は、この期間の35 billion minutesから60 billion minutesのピークまで、毎年一貫して増加しました。携帯電話の通話時間は、1995年の約3 billion minutesから2002年には約45 billion minutesとより急速に増加しました。この数字は、1999年から2001年にかけて劇的な増加を示し、約12 billion minutesから約40 billion minutesへと3倍以上に増加しました。前者の継続的な成長と後者の急増は、2002年の期間末で3つのカテゴリーの差を大きく縮めました。
ダイナミック折れ線グラフ その1
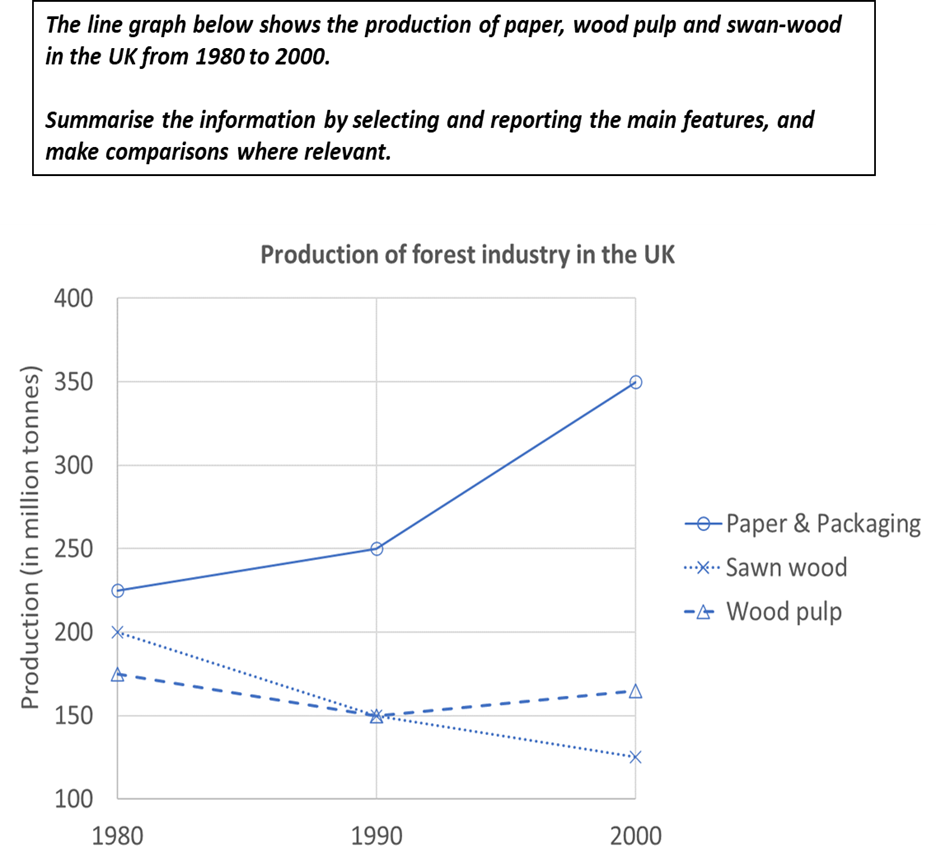
サンプル回答&ポイント解説
サンプル回答
The line chart illustrates production trends in the UK’s forestry sector between 1980 and 2000, assessed at ten-year intervals. Overall, paper & packaging, which was always depicted the highest output over the two decades, increased most significantly, whereas manufacturing of sawn-wood and wood pulp showed downward trends over the period.
折れ線グラフは、1980年から2000年までの英国の林業部門の生産動向を10年ごとに示したものである。全体では、過去数十年間で最も生産量が多かった紙・包装(Paper&Packaging)が最も大きく増加したが、製材(Swan wood)・木材パルプ(Wood pulp)の生産量は減少傾向にあった。
The production of paper and packaging produced, which began at approximately 230 million tonnes in 1980, increased slightly to 250 million tonnes by 1990, after which it soared to 350 million tonnes during the next decade, making it the dominantly produced item by a substantial margin among the three products.
紙・包装(Paper&Packaging)の生産量は、1980年に約230 millionトンで始まったが、1990年にはわずかに増加して250 millionトンとなり、その後の十年間で350 millionトンまで急増し、これらの製品の中ではかなりの差で圧倒的な生産量となった。
The production of sawn wood commenced at 200 million tonnes in 1980 declined steadily to 150 million tonnes in 1990 and further dropped to just below 130 million tonnes by 2000. Wood pulp production began at approximately 175 million tonnes in 1980 and decreased at a relatively slower rate than sawn wood reaching 150 million tonnes in 1990 when the output superseded sawn wood. Subsequently, manufacturing of wood pulp recovered marginally to almost 160 million tonnes in 2000.
製材(Swan wood)の生産量は、1980年に200 millionトンで始まったが、1990年には150 millionトンまで着実に減少し、2000年には130 millionトン弱まで減少した。木材パルプWood pulp)の生産量は、1980年に約175 millionトンで始まったが、製材よりも比較的ゆっくりと減少し、1990年には150 millionトンに達し、製材が生産量を上回った。その後、木材パルプの生産量は、2000年には約160 millionトンまでわずかに回復した。
ポイント解説
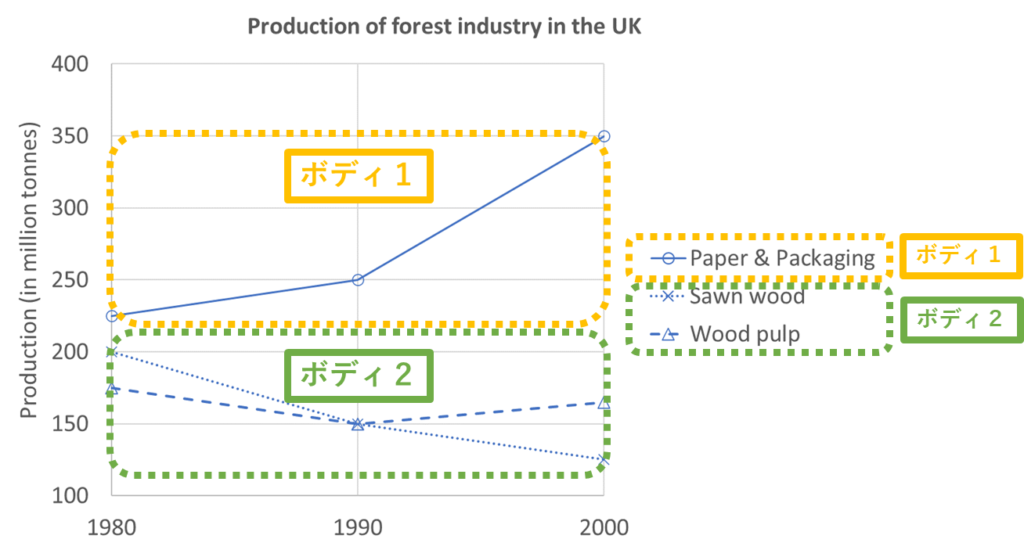
イントロダクション
1文目:問題文のパラフレイズ
- 問題文のパラフレイズについてはこちら
(問題文)The line graph below shows the production of paper, wood pulp and swan-wood in the UK from 1980 to 2000.
⇓ ⇓ ⇓
(パラフレイズ)The line chart illustrates production trends in the UK’s forestry sector between 1980 and 2000, assessed at ten-year intervals.
折れ線グラフは、1980年から2000年までの英国の林業部門の生産動向を10年ごとに示したものである。
2文目:Overall
- Overallについてはこちら
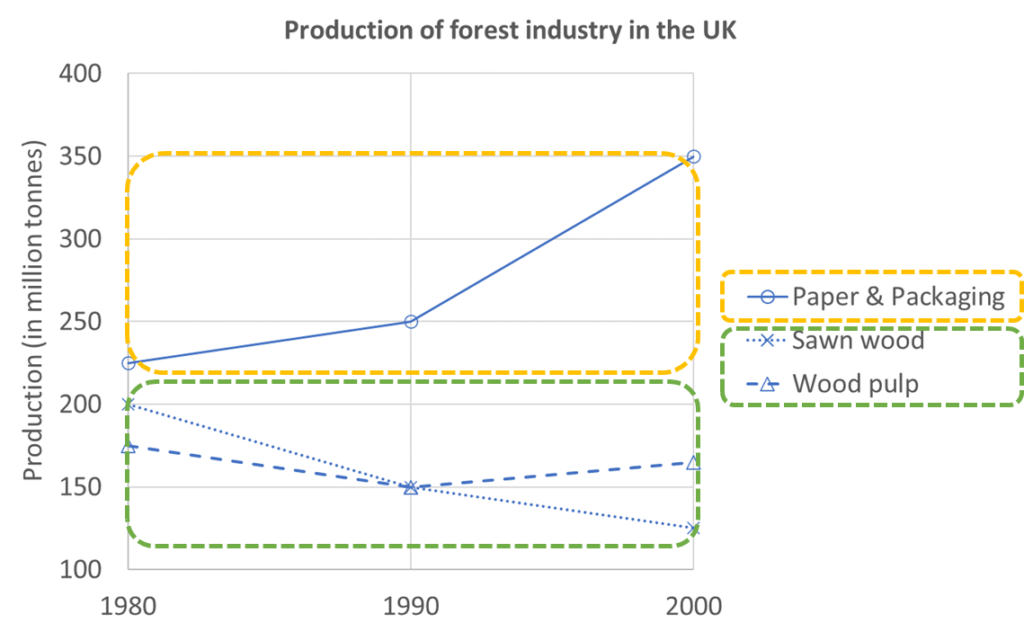
Overall 1文目
paper & packagingはどの年でも最も多くの生産量を占めており増加傾向にあった(オレンジ)、一方でsawn-woodとwood pulpは1980年と2000年を比較すると減少傾向にあった (緑)
Overall, paper & packaging, which was always depicted the highest output over the two decades, increased most significantly, whereas manufacturing of sawn-wood and wood pulp showed downward trends over the period.
全体では、過去数十年間で最も生産量が多かった紙・包装(Paper&Packaging)が最も大きく増加したが、製材(Swan wood)・木材パルプ(Wood pulp)の生産量は減少傾向にあった。
ポイント
イントロダクションパラグラフ全体
The line chart illustrates production trends in the UK’s forestry sector between 1980 and 2000, assessed at ten-year intervals. Overall, paper & packaging, which was always depicted the highest output over the two decades, increased most significantly, whereas manufacturing of sawn-wood and wood pulp showed downward trends over the period.
折れ線グラフは、1980年から2000年までの英国の林業部門の生産動向を10年ごとに示したものである。全体では、過去数十年間で最も生産量が多かった紙・包装(Paper&Packaging)が最も大きく増加したが、製材(Swan wood)・木材パルプ(Wood pulp)の生産量は減少傾向にあった。
ボディ1
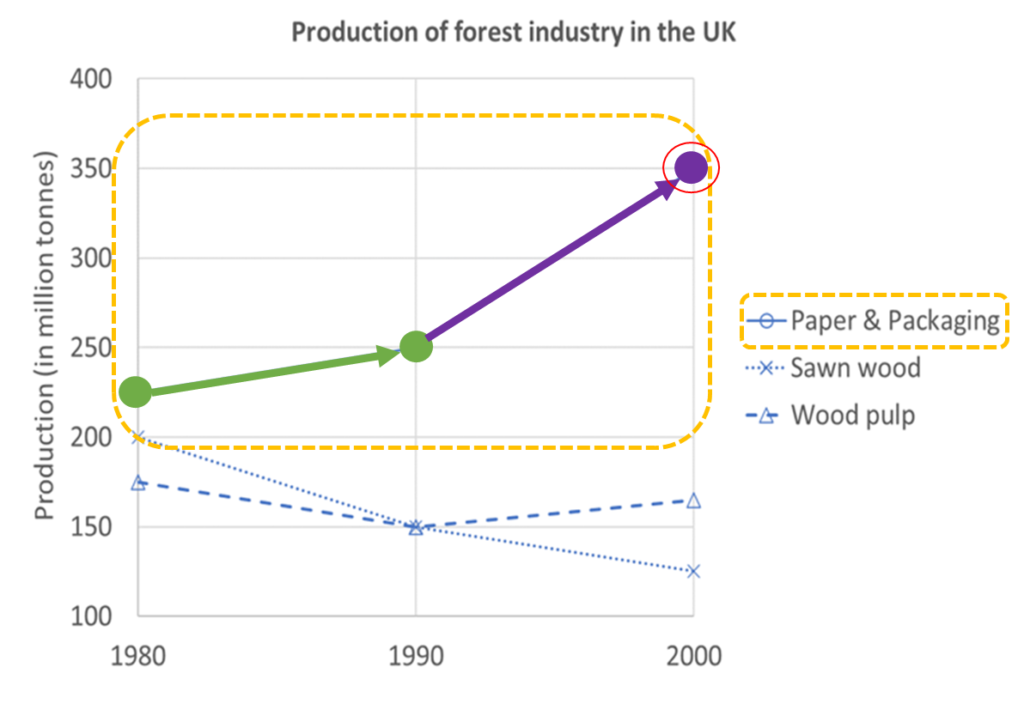
ボディ1 1文目
paper and packagingについて1980年に230 millionでスタートして1990年に250 millionに上昇(緑)、その後次の10年(1990年→2000年)で350 millionに急上昇(紫)して、3つの製品のなかで他と大きな差をつけて最も生産量が多い品になった(赤)。
The production of paper and packaging produced, which began at approximately 230 million tonnes in 1980, increased slightly to 250 million tonnes by 1990, after which it soared to 350 million tonnes during the next decade, making it the dominantly produced item by a substantial margin among the three products.
紙・包装(Paper&Packaging)の生産量は、1980年に約230 millionトンで始まったが、1990年にはわずかに増加して250 millionトンとなり、その後の十年間で350 millionトンまで急増し、これらの製品の中ではかなりの差で圧倒的な生産量となった。
ポイント
ボディ1全体
The production of paper and packaging produced, which began at approximately 230 million tonnes in 1980, increased slightly to 250 million tonnes by 1990, after which it soared to 350 million tonnes during the next decade, making it the dominantly produced item by a substantial margin among the three products.
紙・包装(Paper&Packaging)の生産量は、1980年に約230 millionトンで始まったが、1990年にはわずかに増加して250 millionトンとなり、その後の十年間で350 millionトンまで急増し、これらの製品の中ではかなりの差で圧倒的な生産量となった。
ボディ2
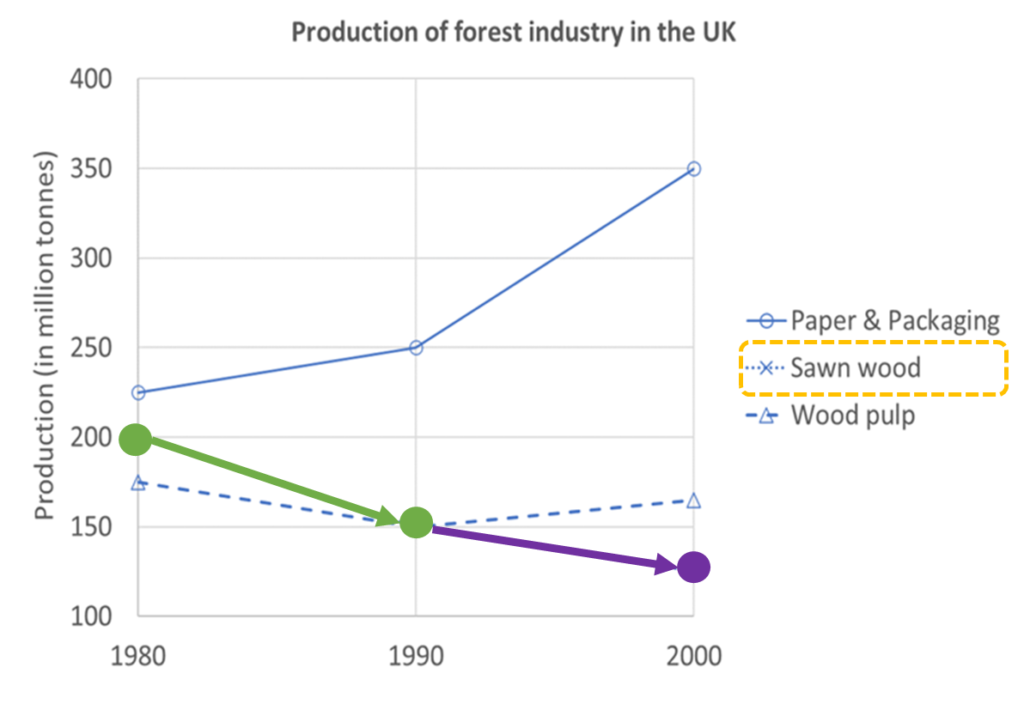
ボディ2 1文目
sawn woodは1980年に200 millionでスタートして1990年に150 millionに減少(緑)、そして2000年には130 millionにさらに減少(紫)した。
The production of sawn wood commenced at 200 million tonnes in 1980 declined steadily to 150 million tonnes in 1990 and further dropped to just below 130 million tonnes by 2000.
製材(Swan wood)の生産量は、1980年に200 millionトンで始まったが、1990年には150 millionトンまで着実に減少し、2000年には130 millionトン弱まで減少した。
ポイント
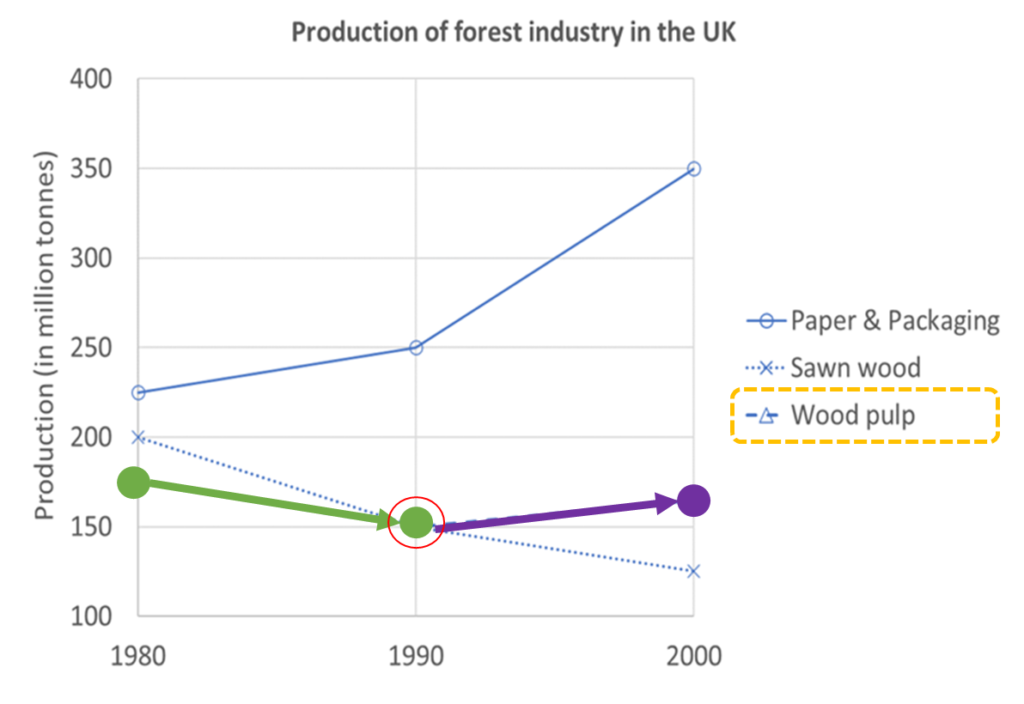
ボディ2 2文目&3文目
wood pulpの生産量は1980年に175 millionで始まり1990年に150 millionまでゆっくりと下がった(緑)。1990年にはsawn woodの生産量を上回った(赤)。その後、2000年には160 millionまで回復した(紫)。
Wood pulp production began at approximately 175 million tonnes in 1980 and decreased at a relatively slower rate than sawn wood reaching 150 million tonnes in 1990 when the output superseded sawn wood. Subsequently, manufacturing of wood pulp recovered marginally to almost 160 million tonnes in 2000.
木材パルプWood pulp)の生産量は、1980年に約175 millionトンで始まったが、製材よりも比較的ゆっくりと減少し、1990年には150 millionトンに達し、製材が生産量を上回った。その後、木材パルプの生産量は、2000年には約160 millionトンまでわずかに回復した。
ポイント
ボディ2全体
The production of sawn wood commenced at 200 million tonnes in 1980 declined steadily to 150 million tonnes in 1990 and further dropped to just below 130 million tonnes by 2000. Wood pulp production began at approximately 175 million tonnes in 1980 and decreased at a relatively slower rate than sawn wood reaching 150 million tonnes in 1990 when the output superseded sawn wood. Subsequently, manufacturing of wood pulp recovered marginally to almost 160 million tonnes in 2000.
製材(Swan wood)の生産量は、1980年に200 millionトンで始まったが、1990年には150 millionトンまで着実に減少し、2000年には130 millionトン弱まで減少した。木材パルプWood pulp)の生産量は、1980年に約175 millionトンで始まったが、製材よりも比較的ゆっくりと減少し、1990年には150 millionトンに達し、製材が生産量を上回った。その後、木材パルプの生産量は、2000年には約160 millionトンまでわずかに回復した。
ダイナミック折れ線グラフ その2
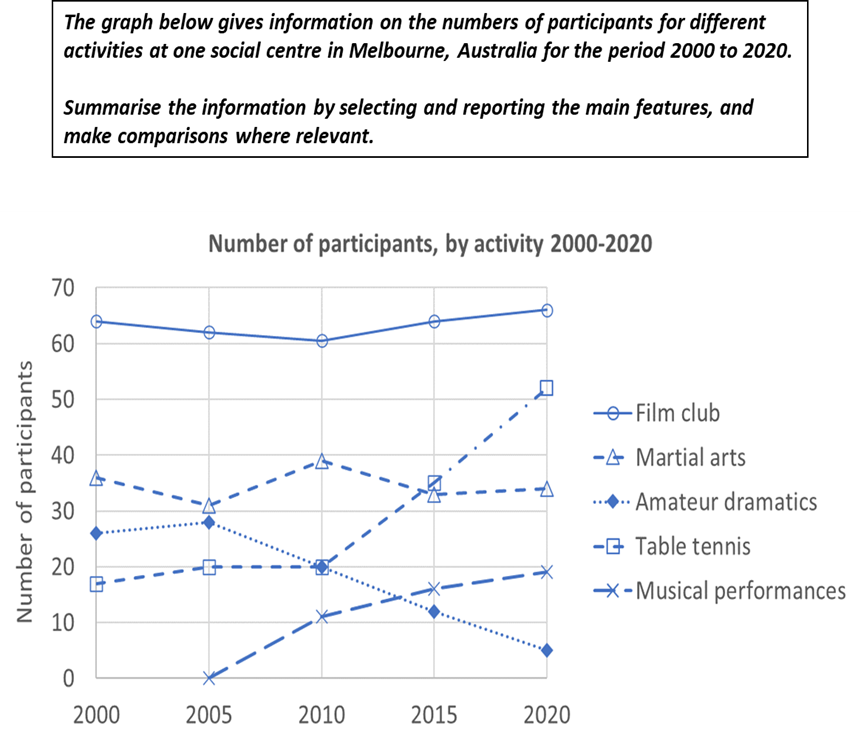
サンプル回答&ポイント解説
サンプル回答
The line chart illustrates participants’ trends of engagement across various activities at a social centre in Melbourne, Australia from 2000 to 2020. Overall, the number of participants in film clubs, table tennis, and musical performances increased to varying degrees, whereas participation in martial arts and amateur drama exhibited trends of stability and decline, respectively. Film club had been the most popular activity during the period, though table tennis demonstrated the strongest growth.
折れ線グラフは、2000年から2020年までのオーストラリア・メルボルンのソーシャルセンターにおけるさまざまな活動の参加者の傾向を示している。全体的には、映画クラブ、卓球、ミュージカルの参加者数は程度の差こそあれ増加したが、武道とアマチュア演劇の参加者数はそれぞれ安定と減少の傾向を示した。この期間、映画クラブは最も人気のある活動で、卓球は最も大きな伸びを示した。
The number of individuals who participated in the film clubs was just below 65 in 2000, which gradually dipped to almost 60 in 2010, before it recovered to slightly above 65 in 2020. Table tennis showed a moderate increase from about 17 to 20 participations during the first five-year period after which it remained stable at the same level for the next five years, and after that, it surged to just over 50 by 2020. Musical performances, which was introduced in 2005, saw a continuous growth with participant numbers rising from just above 10 in 2010 to nearly 20 by the end of the period.
映画クラブの参加者数は、2000年には65人弱であったが、2010年には60人近くまで徐々に減少し、2020年には65人強まで回復した。卓球の参加者数は、最初の5年間で17人から20人へと緩やかに増加し、その後の5年間は横ばいで推移したが、2020年には50人強まで急増した。2005年に始まったミュージカルは継続的に増加し、参加者数は2010年の10人強から20人近くまで増加した。
Contrastingly, the trend for martial arts was comparatively stable, fluctuating between 30 and 40 participants throughout the period. This figure was, however, overtaken by table tennis in 2015. The participants in amateur dramatics, commencing with 26 members in 2000, rose slightly to nearly 30 during the first half-decade before showing continuous decline to merely 6 participants during the next 15 years.
これとは対照的に、武道の傾向は比較的安定しており、30人から40人の間で推移していた。しかし、この数字は2015年に卓球に抜かれた。アマチュア演劇の参加者は、2000年に26人から始まり、最初の半年間で30人近くまでわずかに増加したが、その後の15年間では6人にまで減少し続けた。
ポイント解説
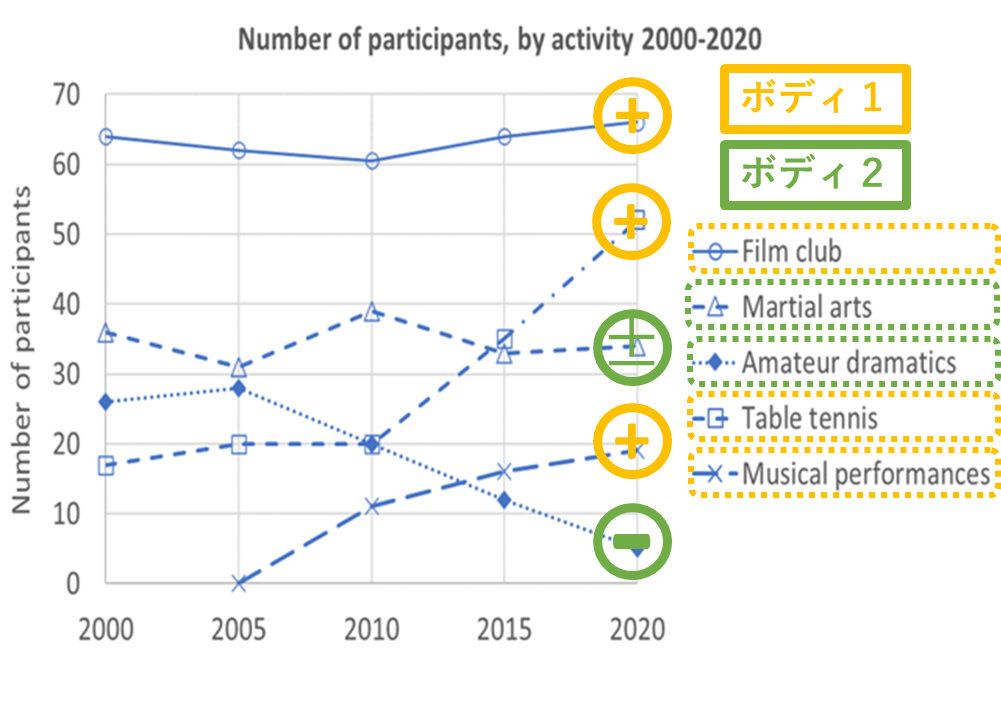
イントロダクション
1文目:問題文のパラフレイズ
- 問題文のパラフレイズについてはこちら
(問題文)The graph below gives information on the numbers of participants for different activities at one social centre in Melbourne, Australia for the period 2000 to 2020.
⇓ ⇓ ⇓
(パラフレイズ)The line chart illustrates participants’ trends of engagement across various activities at a social centre in Melbourne, Australia from 2000 to 2020.
折れ線グラフは、2000年から2020年までのオーストラリア・メルボルンのソーシャルセンターにおけるさまざまな活動の参加者の傾向を示している。
2文目:Overall
- Overallについてはこちら
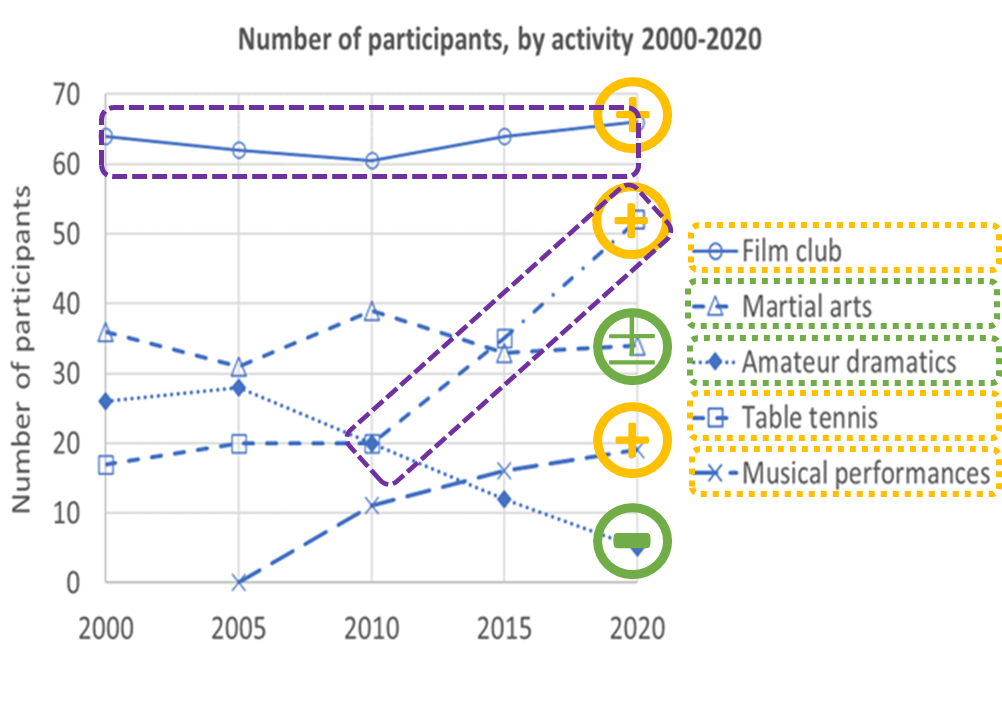
Overall 1文目
film clubs, table tennis, musical performancesは2000年から2020の間でメンバーが増えて(オレンジ)、martial artsはメンバー数ほぼ変わらず、amateur dramaは減少した(緑)。
Overall, the number of participants in film clubs, table tennis, and musical performances increased to varying degrees, whereas participation in martial arts and amateur drama exhibited trends of stability and decline, respectively.
全体的には、映画クラブ、卓球、ミュージカルの参加者数は程度の差こそあれ増加したが、武道とアマチュア演劇の参加者数はそれぞれ安定と減少の傾向を示した。
ポイント
- 上がる/増える(increased)の表現はこちら、下がる/減る(decline)の表現はこちら、変わらない/一定(stability)の表現はこちら
- whereasを使ったOverallでの対比表現はこちら
Overall 2文目
Film clubは2000年から2020年にかけて一番人気があり、table tennisは一番人数が増えた(紫)。
Film club had been the most popular activity during the period, though table tennis demonstrated the strongest growth.
この期間、映画クラブは最も人気のある活動で、卓球は最も大きな伸びを示した。
ポイント
- ボディ1、ボディ2に分ける特徴以外にも、最もメンバーが多い(most popular)クラブ・最もメンバーが増えた(strongest growth)クラブを書きました。
イントロダクションパラグラフ全体
The line chart illustrates participants’ trends of engagement across various activities at a social centre in Melbourne, Australia from 2000 to 2020. Overall, the number of participants in film clubs, table tennis, and musical performances increased to varying degrees, whereas participation in martial arts and amateur drama exhibited trends of stability and decline, respectively. Film club had been the most popular activity during the period, though table tennis demonstrated the strongest growth.
折れ線グラフは、2000年から2020年までのオーストラリア・メルボルンのソーシャルセンターにおけるさまざまな活動の参加者の傾向を示している。全体的には、映画クラブ、卓球、ミュージカルの参加者数は程度の差こそあれ増加したが、武道とアマチュア演劇の参加者数はそれぞれ安定と減少の傾向を示した。この期間、映画クラブは最も人気のある活動で、卓球は最も大きな伸びを示した。
ボディ1
ボディ1 1文目
Film clubsの参加者は2000年には65人だったのが2010年には60人に減少(緑)、しかし2020年には65人を少し上回るくらいに増加した(紫)。
The number of individuals who participated in the film clubs was just below 65 in 2000, which gradually dipped to almost 60 in 2010, before it recovered to slightly above 65 in 2020.
映画クラブの参加者数は、2000年には65人弱であったが、2010年には60人近くまで徐々に減少し、2020年には65人強まで回復した。
ポイント
ボディ1 2文目
Table tennisは最初の5年(2000年→2005年)で約17人から20人に増え(緑)、その後の5年(2005年→2010年)は同じ人数を維持(オレンジ)し、その後2020年にかけて50人上回る人数に増えた(紫)。
Table tennis showed a moderate increase from about 17 to 20 participations during the first five-year period after which it remained stable at the same level for the next five years, and after that, it surged to just over 50 by 2020.
卓球の参加者数は、最初の5年間で17人から20人へと緩やかに増加し、その後の5年間は横ばいで推移したが、2020年には50人強まで急増した。
ポイント
ボディ1 3文目
Musical performancesは2005年に設立されて2010年には10人を少し超える人数(オレンジ)、2020年には20人弱にまで増えた(緑)。
Musical performances, which was introduced in 2005, saw a continuous growth with participant numbers rising from just above 10 in 2010 to nearly 20 by the end of the period.
2005年に始まったミュージカルは継続的に増加し、参加者数は2010年の10人強から20人近くまで増加した。
ポイント
ボディ1全体
The number of individuals who participated in the film clubs was just below 65 in 2000, which gradually dipped to almost 60 in 2010, before it recovered to slightly above 65 in 2020. Table tennis showed a moderate increase from about 17 to 20 participations during the first five-year period after which it remained stable at the same level for the next five years, and after that, it surged to just over 50 by 2020. Musical performances, which was introduced in 2005, saw a continuous growth with participant numbers rising from just above 10 in 2010 to nearly 20 by the end of the period.
映画クラブの参加者数は、2000年には65人弱であったが、2010年には60人近くまで徐々に減少し、2020年には65人強まで回復した。卓球の参加者数は、最初の5年間で17人から20人へと緩やかに増加し、その後の5年間は横ばいで推移したが、2020年には50人強まで急増した。2005年に始まったミュージカルは継続的に増加し、参加者数は2010年の10人強から20人近くまで増加した。
ボディ2
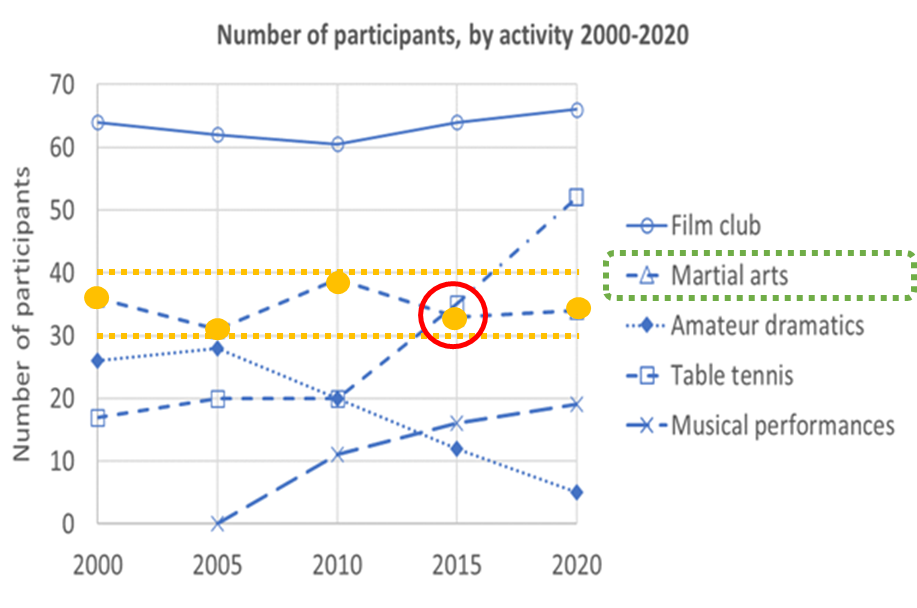
ボディ2 1文目&2文目
Martial artsは他よりも人数の変動が安定して30人と40人の間を変動していた(オレンジ)。また、人数は2015年にTable tennisに抜かれた(赤)。
Contrastingly, the trend for martial arts was comparatively stable, fluctuating between 30 and 40 participants throughout the period. This figure was, however, overtaken by table tennis in 2015.
これとは対照的に、武道の傾向は比較的安定しており、30人から40人の間で推移していた。しかし、この数字は2015年に卓球に抜かれた。
ポイント
ボディ2 3文目
Amateur dramaticsは2000年は26人のメンバーで2005年に30人弱に上がり(オレンジ)、2020年にはたった6人にまで徐々に減少した(緑)。
The participants in amateur dramatics, commencing with 26 members in 2000, rose slightly to nearly 30 during the first half-decade before showing continuous decline to merely 6 participants during the next 15 years.
アマチュア演劇の参加者は、2000年に26人から始まり、最初の半年間で30人近くまでわずかに増加したが、その後の15年間では6人にまで減少し続けた。
ポイント
ボディ2全体
Contrastingly, the trend for martial arts was comparatively stable, fluctuating between 30 and 40 participants throughout the period. This figure was, however, overtaken by table tennis in 2015. The participants in amateur dramatics, commencing with 26 members in 2000, rose slightly to nearly 30 during the first half-decade before showing continuous decline to merely 6 participants during the next 15 years.
これとは対照的に、武道の傾向は比較的安定しており、30人から40人の間で推移していた。しかし、この数字は2015年に卓球に抜かれた。アマチュア演劇の参加者は、2000年に26人から始まり、最初の半年間で30人近くまでわずかに増加したが、その後の15年間では6人にまで減少し続けた。
ダイナミック円グラフ その1
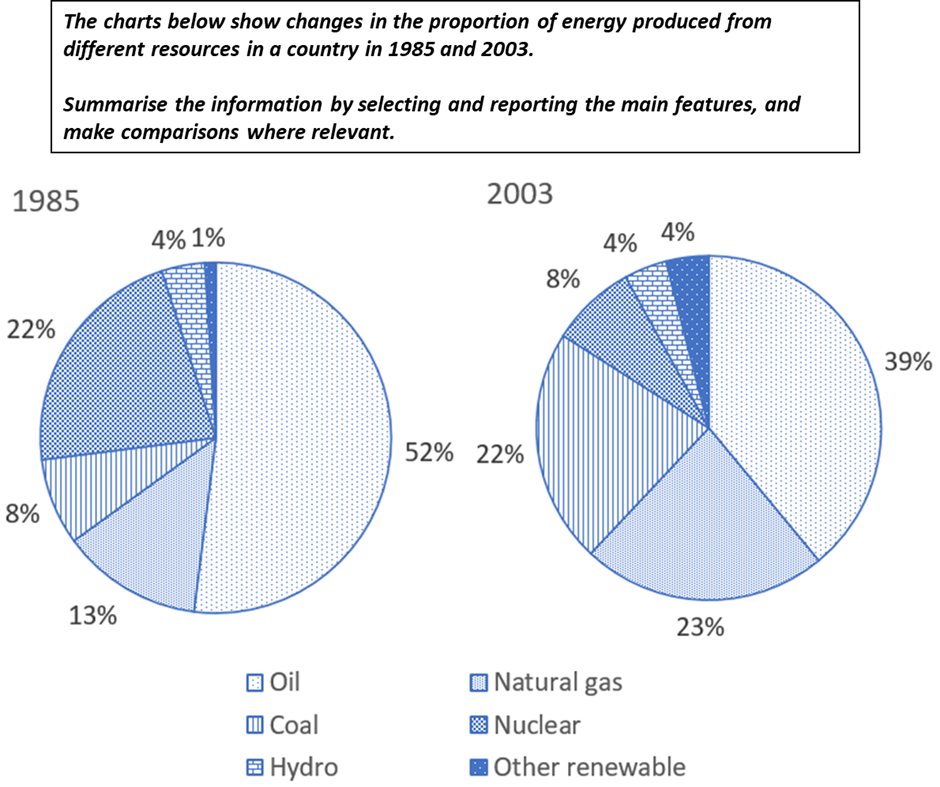
サンプル回答&ポイント解説
サンプル回答
The pie charts illustrate the change in the percentage of distribution of energy produced by several sources in a particular country between 1985 and 2003. Overall, the data reveal an energy shift from the use of oil and nuclear power to relying more on natural gas, coal and various renewable energy sources, although oil still remained the most dominant source of energy in both years.
円グラフは、1985年から2003年の間にある国の複数のエネルギー源によって生産された電力量の分布の割合の変化を示している。全体として、データは、石油と原子力の使用から天然ガス、石炭、および様々な再生可能エネルギー源への依存へのエネルギーシフトを示しているが、石油は依然として両方の年で最も支配的なエネルギー源であった。
The proportion of oil, which accounted for the largest source of power in 1985 at just above half, had declined to nearly two fifth by 2003, although it continued to lead as the primary energy source. Likewise, the use of nuclear power, which was the second most pervasive energy source, lessened to almost one-third from 22% in 1985 to 8% by 2003, positioning it at fourth place. However, the proportion of hydro energy remained constant in both years, contributing only 4%.
石油の割合は、1985年に半分強で最大のエネルギー源を占めていたが、2003年にはほぼ2/5(39%=約40%)に減少した。同様に、2番目に普及していたエネルギー源であった原子力の利用は、1985年の22%から2003年には8%へとほぼ1/3に減少し、第4位となった。しかし、水力エネルギーの割合は両方の年で一定であり、わずか4%であった。
The consumption of natural gas saw a notable increase from third place at 13% in 1985 to nearly one quarter in 2003, making it the second most common energy source. The percentage of coal witnessed the most noticeable increase from just 8% to 22%, nearly matching the share of natural gas. The contributory proportion of other renewable energy sources quadrupled from 1% to 4%, although it represented the lowest proportion in both years.
天然ガスの消費は、1985年の3位の13%から2003年にはほぼ1/4(23%=約25%)へと顕著に増加し、第2位のエネルギー源となった。石炭の割合はわずか8%から22%へと最も顕著に増加し、天然ガスの割合とほぼ同じになった。その他の再生可能エネルギー源の割合は1%から4%へと4倍に増加したが、両方の年で最も低い割合であった。
ポイント解説
イントロダクション
1文目:問題文のパラフレイズ
- 問題文のパラフレイズについてはこちら
(問題文)The charts below show changes in the proportion of energy produced from different resources in a country in 1985 and 2003.
⇓ ⇓ ⇓
(パラフレイズ)The pie charts illustrate the change in the percentage of distribution of energy produced by several sources in a particular country between 1985 and 2003.
円グラフは、1985年から2003年の間にある国の複数のエネルギー源によって生産された電力量の分布の割合の変化を示している。
2文目:Overall
- Overallについてはこちら
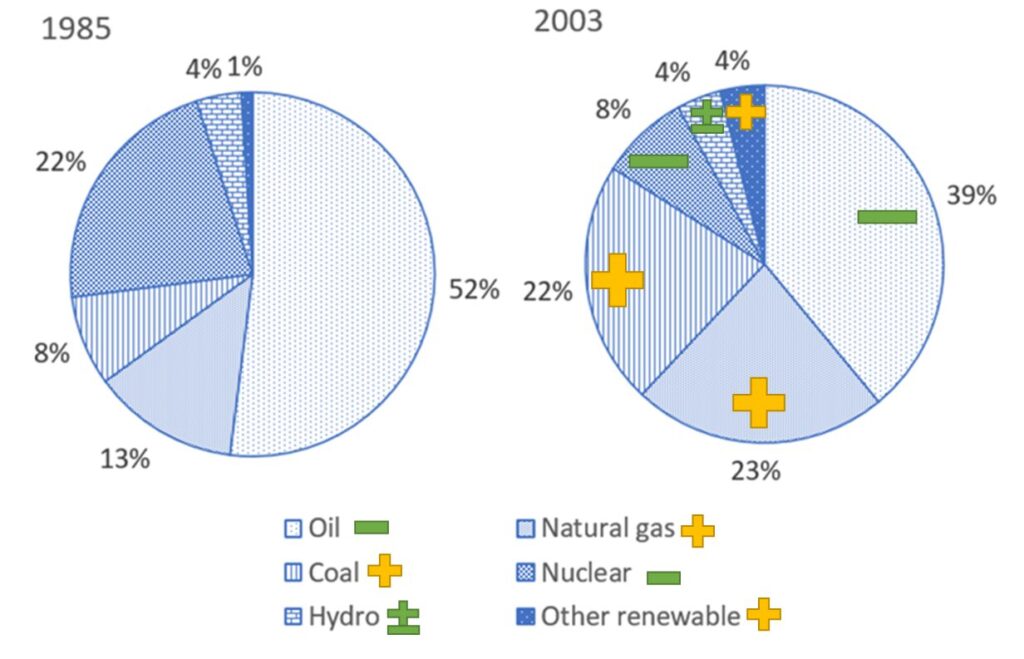
Overall 1文目
1985年と2003年を比較して、oilとnuclear powerの割合が減少して(緑)、natural gasとcoalと renewable energyの割合が増えた(オレンジ)。またoilはどちらの年も最も大きな割合をしめる。
Overall, the data reveal an energy shift from the use of oil and nuclear power to relying more on natural gas, coal and various renewable energy sources, although oil still remained the most dominant source of energy in both years.
全体として、データは、石油と原子力の使用から天然ガス、石炭、および様々な再生可能エネルギー源への依存へのエネルギーシフトを示しているが、石油は依然として両方の年で最も支配的なエネルギー源であった。
イントロダクションパラグラフ全体
The pie charts illustrate the change in the percentage of distribution of energy produced by several sources in a particular country between 1985 and 2003. Overall, the data reveal an energy shift from the use of oil and nuclear power to relying more on natural gas, coal and various renewable energy sources, although oil still remained the most dominant source of energy in both years.
円グラフは、1985年から2003年の間にある国の複数のエネルギー源によって生産された電力量の分布の割合の変化を示している。全体として、データは、石油と原子力の使用から天然ガス、石炭、および様々な再生可能エネルギー源への依存へのエネルギーシフトを示しているが、石油は依然として両方の年で最も支配的なエネルギー源であった。
ボディ1
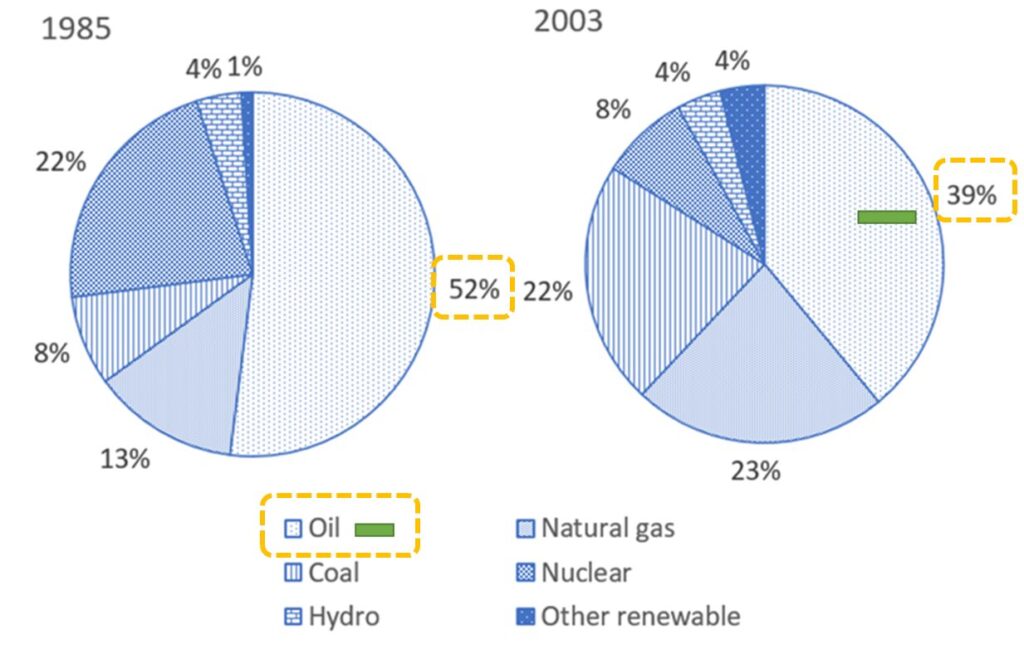
ボディ1 1文目
Oilの割合は52%から39%に減った(オレンジ)。また、減っても主なエネルギー源になっている。
The proportion of oil, which accounted for the largest source of power in 1985 at just above half, had declined to nearly two fifth by 2003, although it continued to lead as the primary energy source.
石油の割合は、1985年に半分強で最大のエネルギー源を占めていたが、2003年にはほぼ2/5(39%=約40%)に減少した。
ポイント
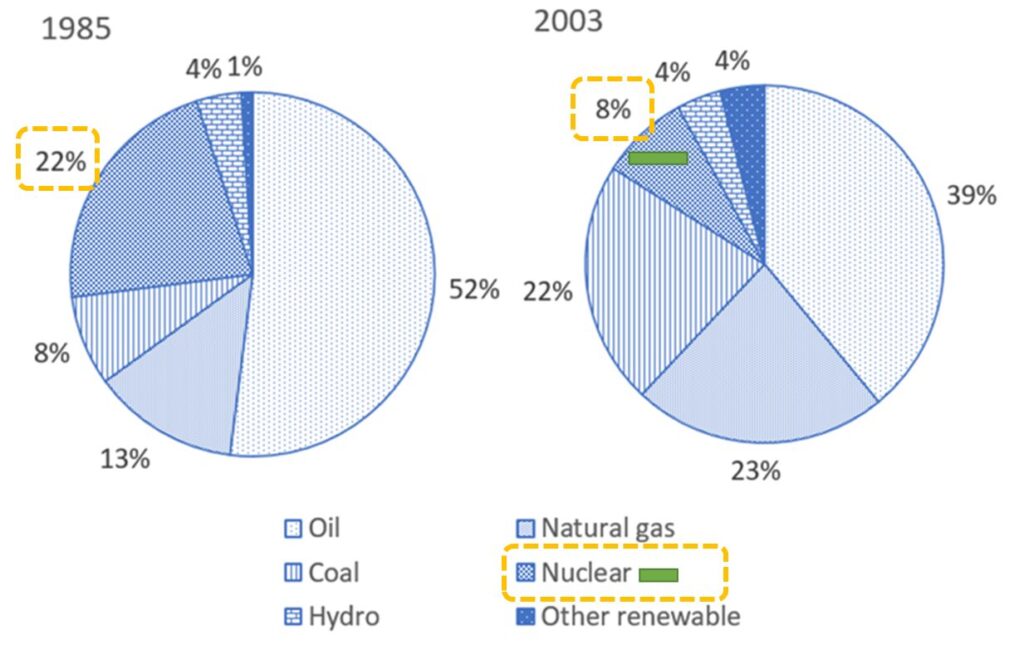
ボディ1 2文目
oilと同様にnuclear powerも22%から8%に減少した(オレンジ)。
Likewise, the use of nuclear power, which was the second most pervasive energy source, lessened to almost one-third from 22% in 1985 to 8% by 2003, positioning it at fourth place.
同様に、2番目に普及していたエネルギー源であった原子力の利用は、1985年の22%から2003年には8%へとほぼ1/3に減少し、第4位となった。
ポイント
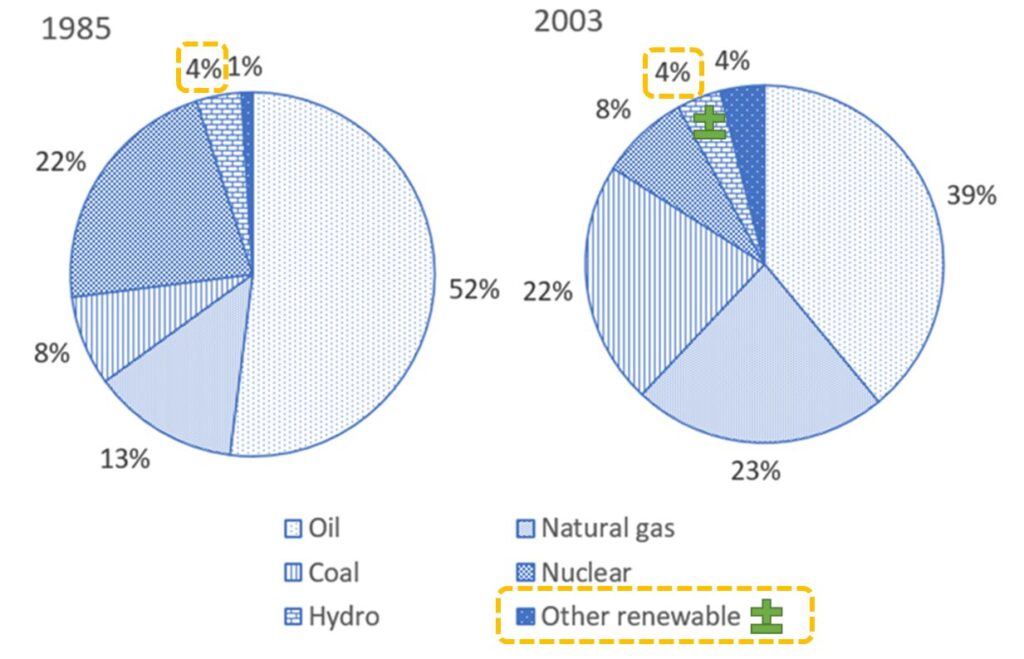
ボディ1 3文目
hydro energyの割合は4%で1985年と2003年で変わらなかった(オレンジ)。
However, the proportion of hydro energy remained constant in both years, contributing only 4%.
しかし、水力エネルギーの割合は両方の年で一定であり、わずか4%であった。
ポイント
- 変わらない/一定(remained constant)の表現はこちら
ボディ1全体
The proportion of oil, which accounted for the largest source of power in 1985 at just above half, had declined to nearly two fifth by 2003, although it continued to lead as the primary energy source. Likewise, the use of nuclear power, which was the second most pervasive energy source, lessened to almost one-third from 22% in 1985 to 8% by 2003, positioning it at fourth place. However, the proportion of hydro energy remained constant in both years, contributing only 4%.
石油の割合は、1985年に半分強で最大のエネルギー源を占めていたが、2003年にはほぼ2/5(39%=約40%)に減少した。同様に、2番目に普及していたエネルギー源であった原子力の利用は、1985年の22%から2003年には8%へとほぼ1/3に減少し、第4位となった。しかし、水力エネルギーの割合は両方の年で一定であり、わずか4%であった。
ボディ2
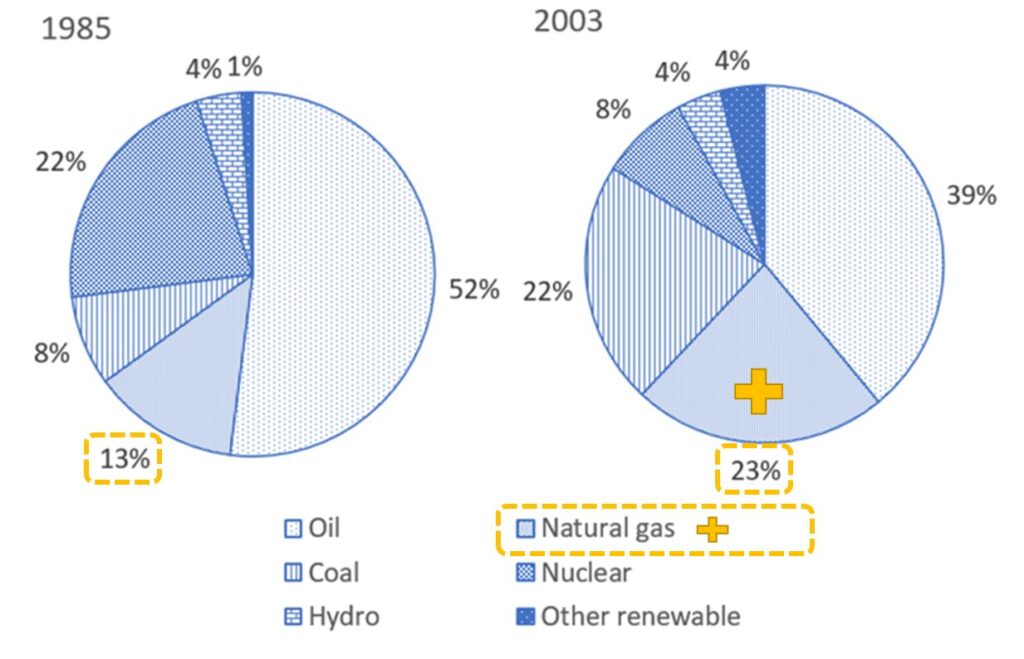
ボディ2 1文目
natural gasの割合は1985年は3番目に多い13%だったのが2003年には23%に増えた(オレンジ)。
The consumption of natural gas saw a notable increase from third place at 13% in 1985 to nearly one quarter in 2003, making it the second most common energy source.
天然ガスの消費は、1985年の3位の13%から2003年にはほぼ1/4(23%=約25%)へと顕著に増加し、第2位のエネルギー源となった。
ポイント
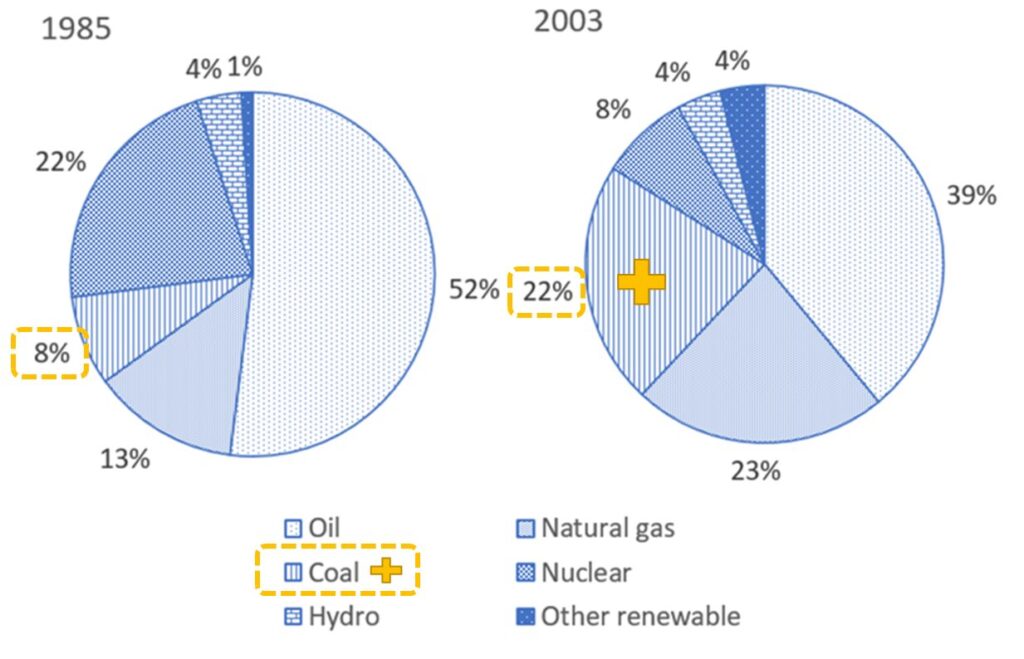
ボディ2 2文目
coalの割合は8%から22%に上がって(オレンジ)、natural gas(23%)とほぼ同じ割合になった。
The percentage of coal witnessed the most noticeable increase from just 8% to 22%, nearly matching the share of natural gas.
石炭の割合はわずか8%から22%へと最も顕著に増加し、天然ガスの割合とほぼ同じになった。
ポイント
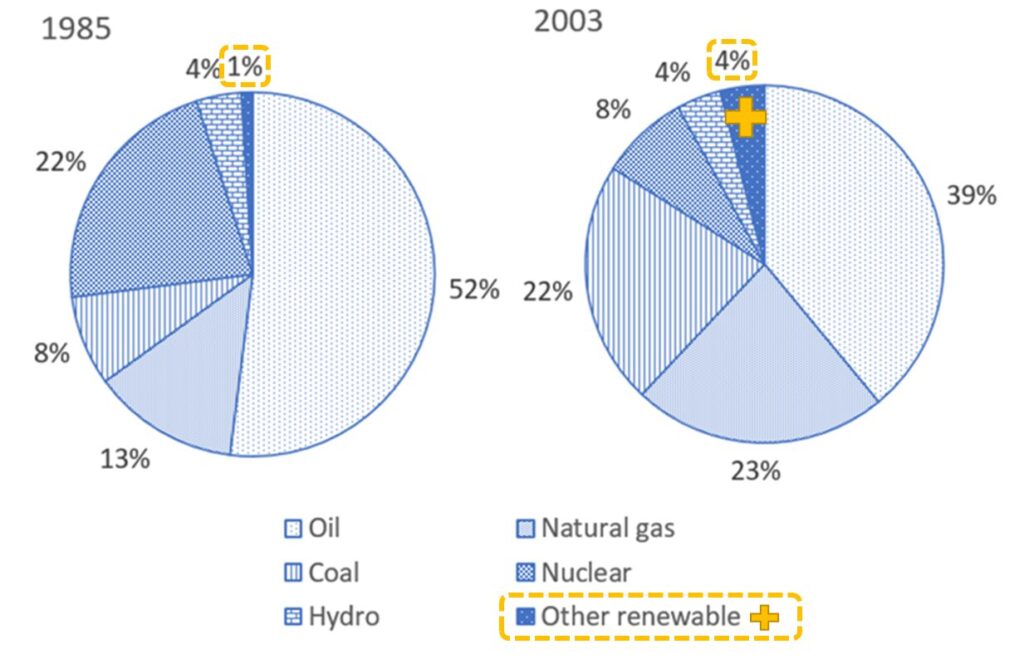
ボディ2 3文目
other renewable energyは1%から4%に減った(オレンジ)。
The contributory proportion of other renewable energy sources quadrupled from 1% to 4%, although it represented the lowest proportion in both years.
その他の再生可能エネルギー源の割合は1%から4%へと4倍に増加したが、両方の年で最も低い割合であった。
ポイント
- ただ1%から4%に減ったと書くのではなく1/4になった(quadrupled)と書きました。何分の1になる表現はこちら
ボディ2全体
The consumption of natural gas saw a notable increase from third place at 13% in 1985 to nearly one quarter in 2003, making it the second most common energy source. The percentage of coal witnessed the most noticeable increase from just 8% to 22%, nearly matching the share of natural gas. The contributory proportion of other renewable energy sources quadrupled from 1% to 4%, although it represented the lowest proportion in both years.
天然ガスの消費は、1985年の3位の13%から2003年にはほぼ1/4(23%=約25%)へと顕著に増加し、第2位のエネルギー源となった。石炭の割合はわずか8%から22%へと最も顕著に増加し、天然ガスの割合とほぼ同じになった。その他の再生可能エネルギー源の割合は1%から4%へと4倍に増加したが、両方の年で最も低い割合であった。
ダイナミック円グラフ その2
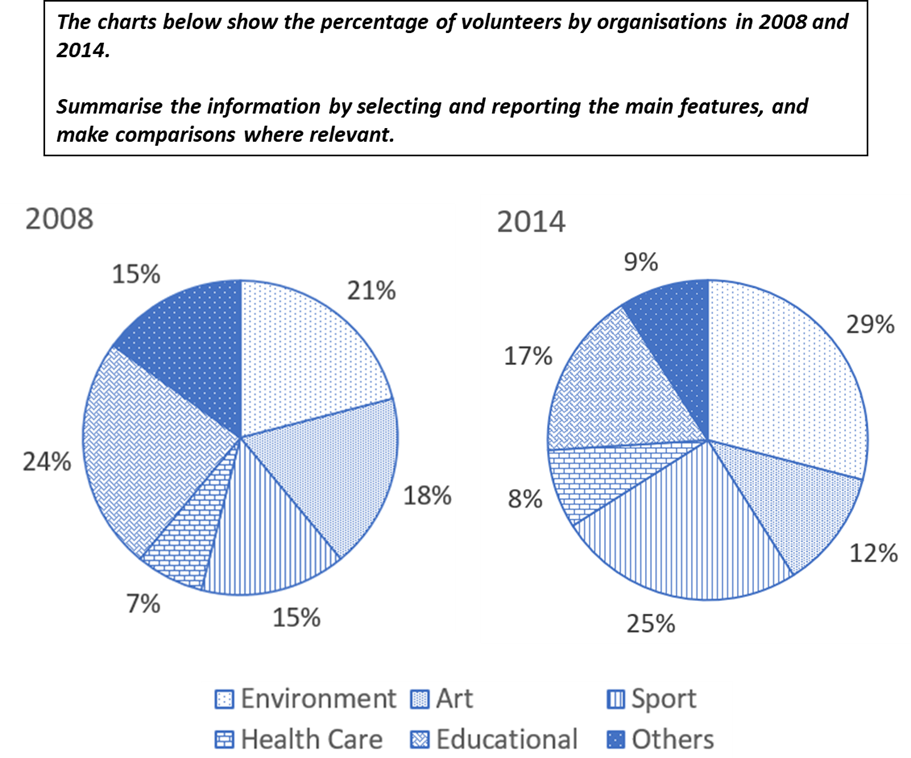
サンプル回答&ポイント解説
サンプル回答
The two pie charts compare the distribution of voluntary workers across six different sections in 2008 and 2014. Overall, the number of volunteers working in the environment, sports and healthcare organisations increased, whereas those in art, education and other sectors decreased.
2つの円グラフは、2008年と2014年の6つの異なる部門におけるボランティア労働者の割合を比較したものです。全体として、環境、スポーツ、医療機関で働くボランティアの数は増加したが、芸術、教育、その他の部門で働くボランティアの数は減少した。
The proportion of voluntary workers engaged in the environment and sports categories increased by 8% and 10%, respectively. The former represented the largest proportion at 29% of the share, and the latter saw a notable increase of 10%, becoming the second largest sector reaching a quarter of the total in 2014. Between these two years, there was a marginal growth of 1% in the number of people volunteering in healthcare category, though the proportion remained the smallest category at 7% in 2008 and 8% in 2014.
2008年と2014年の期間で、環境分野では8%、スポーツ分野では10%増加した。前者は29%と最も大きな割合を占め、後者は10%と顕著に増加して2014年には全体の1/4(25%)に達し2番目に大きな分野となった。医療分野は、2008年7%、2014年8%で、わずか1%の増加であった。
In contrast, the percentage of the other three remaining categories exhibited decreasing trends over the period. The education sector dropped by 7%, and enrolment in art and the others category both declined by 6% to 12% and 9%, respectively. As a result, education sector, which accounted for the largest percentage of volunteers in 2008 at 24%, dipped to third place in 2014 with a share of 17%.
一方、残りの3つの分野の割合は減少傾向を示した。教育分野は7%減少し、芸術分野とその他の分野は6%減少し、それぞれ12%と9%となった。その結果、2008年に24%で最も大きな割合を占めていた教育分野の割合は、2014年には17%で3位に低下した。
ポイント解説
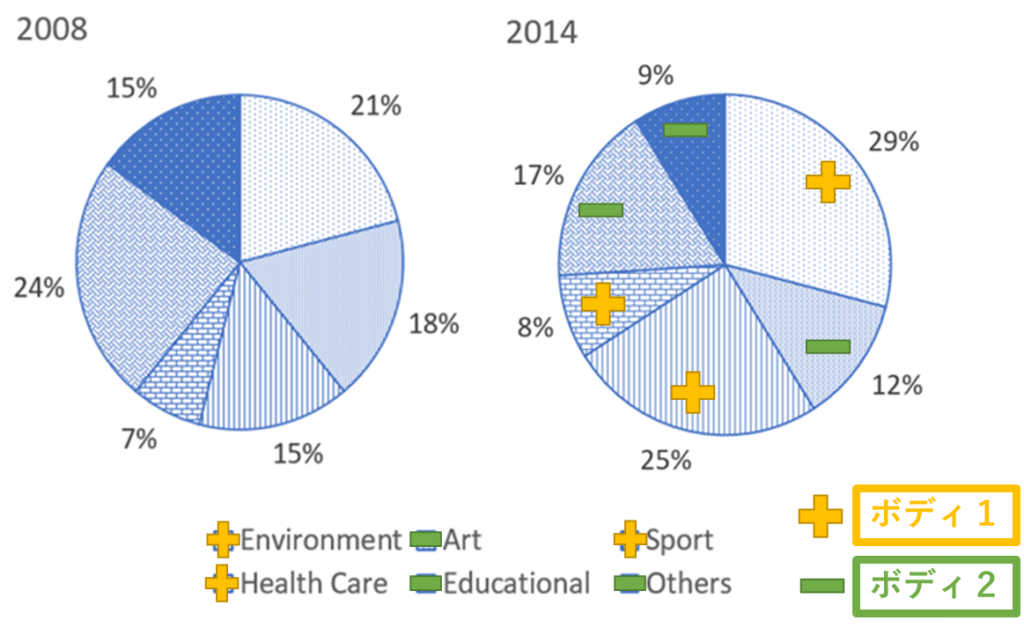
イントロダクション
1文目:問題文のパラフレイズ
- 問題文のパラフレイズについてはこちら
(問題文)The charts below show the percentage of volunteers by organisations in 2008 and 2014.
⇓ ⇓ ⇓
(パラフレイズ)The two pie charts compare the distribution of voluntary workers across six different sections in 2008 and 2014.
2つの円グラフは、2008年と2014年の6つの異なる部門におけるボランティア労働者の割合を比較したものです。
2文目:Overall
- Overallについてはこちら
Overall 1文目
environment, sports, healthcareは増加(オレンジ)し、art, education, otherは減少(緑) した。
Overall, the number of volunteers working in the environment, sports and healthcare organisations increased, whereas those in art, education and other sectors decreased.
全体として、環境、スポーツ、医療機関で働くボランティアの数は増加したが、芸術、教育、その他の部門で働くボランティアの数は減少した。
ポイント
- 増加と減少をwhereasで対比。Overallでの対比表現はこちら
イントロダクションパラグラフ全体
The two pie charts compare the distribution of voluntary workers across six different sections in 2008 and 2014. Overall, the number of volunteers working in the environment, sports and healthcare organisations increased, whereas those in art, education and other sectors decreased.
2つの円グラフは、2008年と2014年の6つの異なる部門におけるボランティア労働者の割合を比較したものです。全体として、環境、スポーツ、医療機関で働くボランティアの数は増加したが、芸術、教育、その他の部門で働くボランティアの数は減少した。
ボディ1
ボディ1 1文目&2文目
environmentのボランティアに取り組んだ人は8%増加(緑)、sportsのボランティアに取り組んだ人は10%増加(紫)した。environmentのボランティア数は2014年には一番大きい割合の29%を占め、sportsのボランティア数は一番多く増え(+10%)、25%で2番目に大きい割合になった。
The proportion of voluntary workers engaged in the environment and sports categories increased by 8% and 10%, respectively. The former represented the largest proportion at 29% of the share, and the latter saw a notable increase of 10%, becoming the second largest sector reaching a quarter of the total in 2014.
2008年と2014年の期間で、環境分野では8%、スポーツ分野では10%増加した。前者は29%と最も大きな割合を占め、後者は10%と顕著に増加して2014年には全体の1/4(25%)に達し2番目に大きな分野となった。
ポイント
ボディ1 3文目
healthcareでボランティアをした人の数は1%増加したが、2008年は7%、2014年は8%でもっとも小さい割合(緑)だった。
Between these two years, there was a marginal growth of 1% in the number of people volunteering in healthcare category, though the proportion remained the smallest category at 7% in 2008 and 8% in 2014.
医療分野は、2008年7%、2014年8%で、わずか1%の増加であった。
ポイント
ボディ1全体
The proportion of voluntary workers engaged in the environment and sports categories increased by 8% and 10%, respectively. The former represented the largest proportion at 29% of the share, and the latter saw a notable increase of 10%, becoming the second largest sector reaching a quarter of the total in 2014. Between these two years, there was a marginal growth of 1% in the number of people volunteering in healthcare category, though the proportion remained the smallest category at 7% in 2008 and 8% in 2014.
2008年と2014年の期間で、環境分野では8%、スポーツ分野では10%増加した。前者は29%と最も大きな割合を占め、後者は10%と顕著に増加して2014年には全体の1/4(25%)に達し2番目に大きな分野となった。医療分野は、2008年7%、2014年8%で、わずか1%の増加であった。
ボディ2
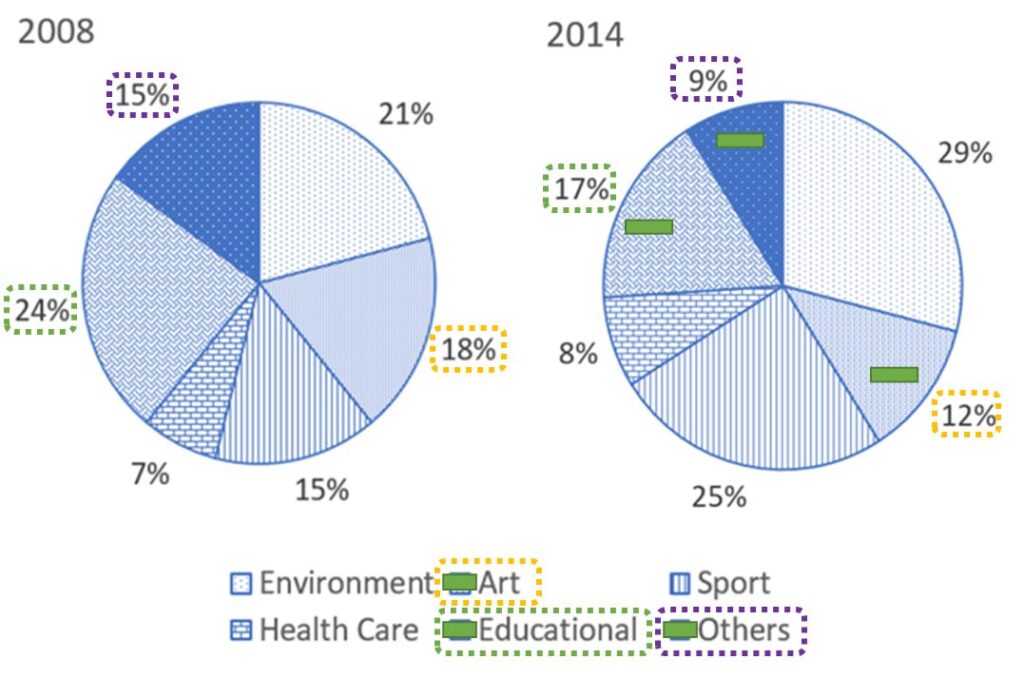
ボディ2 1文目&2文目
education, art, othersは減少した。educationは7%減少し(緑)、artは6%減少し(オレンジ)、othersは6%減少(紫)した。
In contrast, the percentage of the other three remaining categories exhibited decreasing trends over the period. The education sector dropped by 7%, and enrolment in art and the others category both declined by 6% to 12% and 9%, respectively.
一方、残りの3つの分野の割合は減少傾向を示した。教育分野は7%減少し、芸術分野とその他の分野は6%減少し、それぞれ12%と9%となった。
ポイント
ボディ2 3文目
educationは2008年には24%で一番大きい割合を占めていたが、2014年には17%で3番目に大きい割合に下がった。
As a result, education sector, which accounted for the largest percentage of volunteers in 2008 at 24%, dipped to third place in 2014 with a share of 17%.
その結果、2008年に24%で最も大きな割合を占めていた教育分野の割合は、2014年には17%で3位に低下した。
ポイント
ボディ2全体
In contrast, the percentage of the other three remaining categories exhibited decreasing trends over the period. The education sector dropped by 7%, and enrolment in art and the others category both declined by 6% to 12% and 9%, respectively. As a result, education sector, which accounted for the largest percentage of volunteers in 2008 at 24%, dipped to third place in 2014 with a share of 17%.
一方、残りの3つの分野の割合は減少傾向を示した。教育分野は7%減少し、芸術分野とその他の分野は6%減少し、それぞれ12%と9%となった。その結果、2008年に24%で最も大きな割合を占めていた教育分野の割合は、2014年には17%で3位に低下した。
ダイナミック表 その1
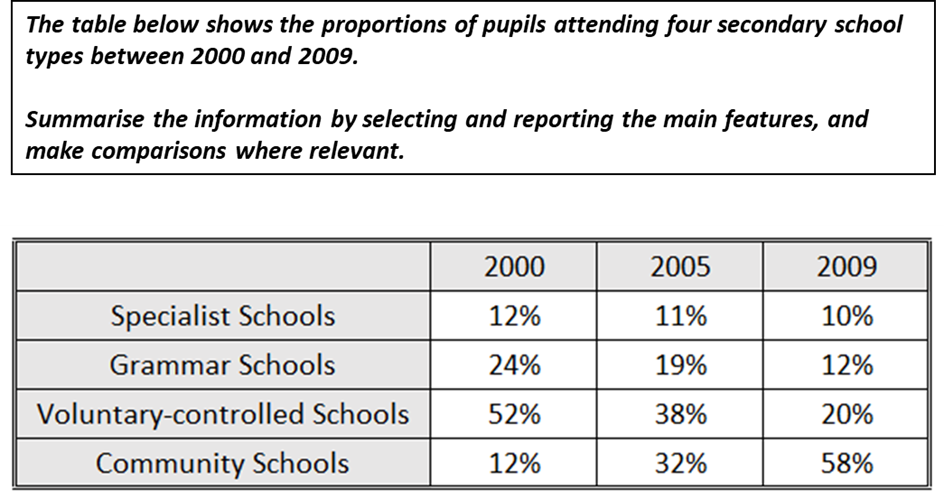
サンプル回答&ポイント解説
サンプル回答
The table presents the percentage of school students attending four types of secondary schools in 2000, 2005, and 2009. Overall, the specialist, grammar, and voluntary-controlled schools experienced a decline in enrolment, whereas community schools emerged as the most preferred option during this period.
表は、2000年、2005年、2009年の4種類の中学校に通う生徒の割合を示している。全体的に、専門学校(Specialist schools)、グラマースクール(Grammar schools)、Voluntary-controlled schoolsは入学者数が減少し、コミュニティ・スクール(Community schools)が最も好まれる選択肢となった。
The proportion of students in voluntary-controlled schools decreased significantly, falling from just over half to merely one-fifth between 2000 and 2009. Likewise, the percentage of students attending grammar schools, which was just under one-quarter in 2000, halved during the same period. In the case of specialist schools, a relatively small proportion of students enrolled, which was 12% in 2000. This statistic dropped by 1% during the period until 2005 and even during the next four years until 2009.
Voluntary-controlled schoolsの生徒の割合は、2000年から2009年の間に半分強(=52%)から1/5(=20%)に大きく減少した。同様に、グラマースクールに通う生徒の割合は、2000年には1/4弱(=24%)であったが、同じ期間に半分(=12%)になった。専門学校の場合、入学者の割合は2000年には12%と比較的少なかった。この割合は2005年までの期間に1%減少し、2009年までの次の4年間でも1%減少した。
In contrast to these declines, community schools witnessed a sharp rise in popularity. Enrolment in these schools, which accounted for only a small minority at 12% in 2000, more than doubled to 32% by 2005 before surging to 58% in 2009, making them the leading provider of secondary education by the end of the period.
これらの減少とは対照的に、コミュニティ・スクールの人気は急上昇した。これらの学校への入学者は、2000年には12%と少数派に過ぎなかったが、2005年には倍以上の32%になり、2009年には58%に急増し、同期間の終わりには中等教育の主要な提供者となった。
ポイント解説
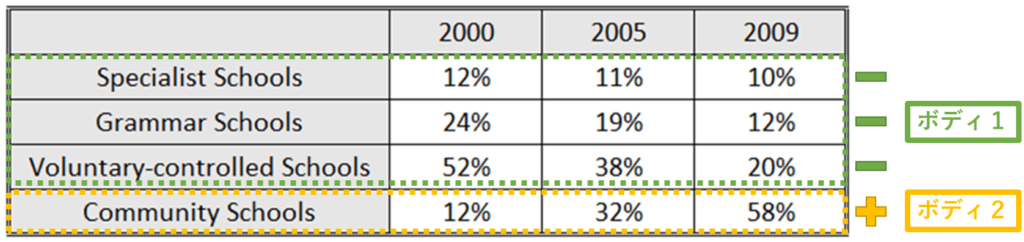
イントロダクション
1文目:問題文のパラフレイズ
- 問題文のパラフレイズについてはこちら
(問題文)The table below shows the proportions of pupils attending four secondary school types between 2000 and 2009.
⇓ ⇓ ⇓
(パラフレイズ)The table presents the percentage of school students attending four types of secondary schools in 2000, 2005, and 2009.
表は、2000年、2005年、2009年の4種類の中学校に通う生徒の割合を示している。
2文目:Overall
- Overallについてはこちら
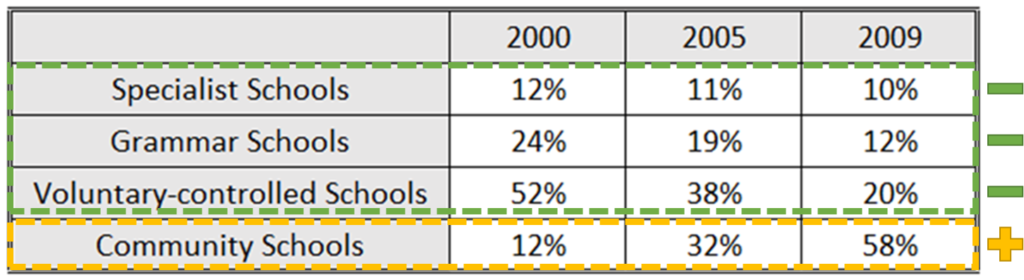
Overall 1文目
specialist, grammar, voluntary-controlled schoolsは減少した(緑)一方で、community schoolsは増加した(オレンジ)。
Overall, the specialist, grammar, and voluntary-controlled schools experienced a decline in enrolment, whereas community schools emerged as the most preferred option during this period.
全体的に、専門学校(Specialist schools)、グラマースクール(Grammar schools)、Voluntary-controlled schoolsは入学者数が減少し、コミュニティ・スクール(Community schools)が最も好まれる選択肢となった。
ポイント
- 増加と減少をwhereasで対比。Overallでの対比表現はこちら
イントロダクションパラグラフ全体
The table presents the percentage of school students attending four types of secondary schools in 2000, 2005, and 2009. Overall, the specialist, grammar, and voluntary-controlled schools experienced a decline in enrolment, whereas community schools emerged as the most preferred option during this period.
表は、2000年、2005年、2009年の4種類の中学校に通う生徒の割合を示している。全体的に、専門学校(Specialist schools)、グラマースクール(Grammar schools)、Voluntary-controlled schoolsは入学者数が減少し、コミュニティ・スクール(Community schools)が最も好まれる選択肢となった。
ボディ1
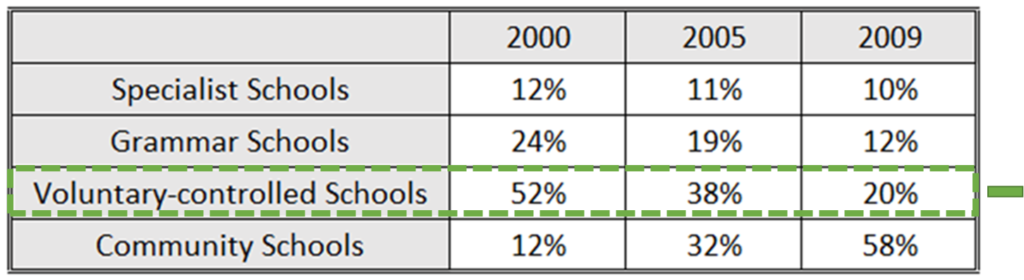
ボディ1 1文目
voluntary-controlled schoolsの割合が最も大きく下がり2000年には52%だったのが2009年には20%になった。
The proportion of students in voluntary-controlled schools decreased significantly, falling from just over half to merely one-fifth between 2000 and 2009.
Voluntary-controlled schoolsの生徒の割合は、2000年から2009年の間に半分強(=52%)から1/5(=20%)に大きく減少した。
ポイント
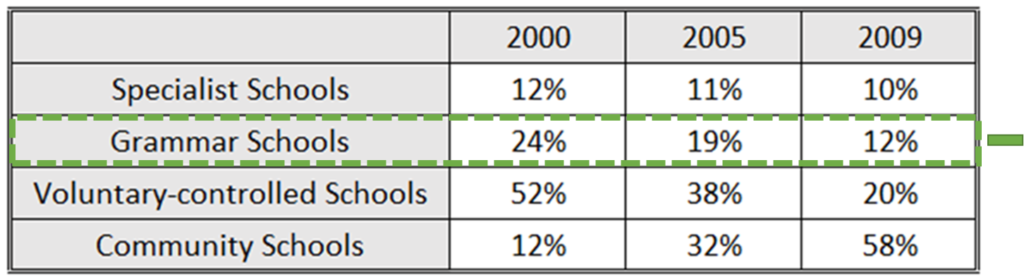
ボディ1 2文目
grammar schoolsは2000年に24%だったのが2000年には12%に半減した。
Likewise, the percentage of students attending grammar schools, which was just under one-quarter in 2000, halved during the same period.
同様に、グラマースクールに通う生徒の割合は、2000年には1/4弱(=24%)であったが、同じ期間に半分(=12%)になった。
ポイント
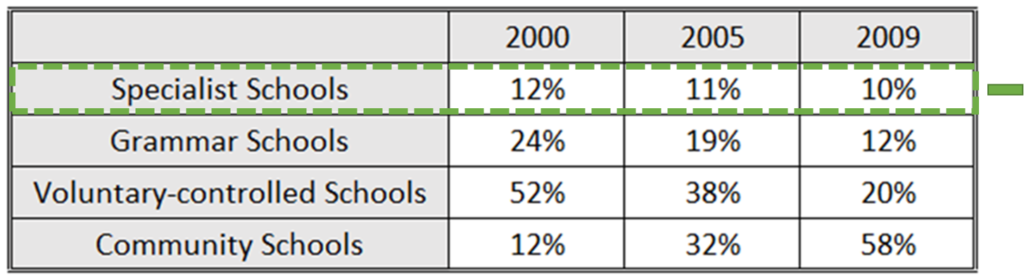
ボディ1 3文目&4分目
specialist schoolsは2000年に12%でボディ1のパラグラフで対象にしているspecialist, grammar, voluntary-controlled schoolsの中では小さい%だった。
In the case of specialist schools, a relatively small proportion of students enrolled, which was 12% in 2000. This statistic dropped by 1% during the period until 2005 and even during the next four years until 2009.
専門学校の場合、入学者の割合は2000年には12%と比較的少なかった。この割合は2005年までの期間に1%減少し、2009年までの次の4年間でも1%減少した。
ポイント
- 関係代名詞(which)を使って数の説明を追加しました。数値の説明の表現方法はこちら
- この3文目&4分目は1文で”Specialist schools, which already catered to a relatively small proportion of pupils at 12% in 2000, experienced a steady decline of 1% by 2005 and again by 2009″.のようにも書けますが、ボディ1の2文目(前の文)と形が同じになってしまうのであえてThis statistic declinedで繋げて2文に分けて書きました。
- 12%→11%→10%の1%づつ減少をduring the period until 2005とeven during the next four years until 2009に分けて書きました。
- 前の文でfalling, halved, declinedを使って減るを表したのでここではdroppedにパラフレイズしました。下がる/減るの表現はこちら
ボディ1全体
The proportion of students in voluntary-controlled schools decreased significantly, falling from just over half to merely one-fifth between 2000 and 2009. Likewise, the percentage of students attending grammar schools, which was just under one-quarter in 2000, halved during the same period. In the case of specialist schools, a relatively small proportion of students enrolled, which was 12% in 2000. This statistic dropped by 1% during the period until 2005 and even during the next four years until 2009.
Voluntary-controlled schoolsの生徒の割合は、2000年から2009年の間に半分強(=52%)から1/5(=20%)に大きく減少した。同様に、グラマースクールに通う生徒の割合は、2000年には1/4弱(=24%)であったが、同じ期間に半分(=12%)になった。専門学校の場合、入学者の割合は2000年には12%と比較的少なかった。この割合は2005年までの期間に1%減少し、2009年までの次の4年間でも1%減少した。
ボディ2
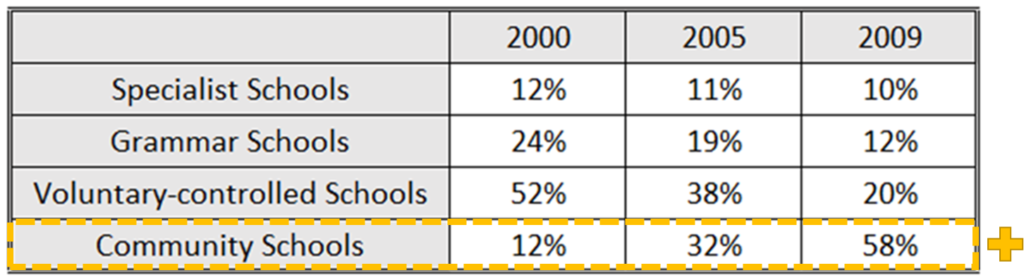
ボディ2 1文目&2文目
community schoolsの割合は増加した。その割合は2000年の12%から2005年に32%に倍以上になり、2009年に58%になり、最も割合の大きいsecondary educationのproviderになった。
In contrast to these declines, community schools witnessed a sharp rise in popularity. Enrolment in these schools, which accounted for only a small minority at 12% in 2000, more than doubled to 32% by 2005 before surging to 58% in 2009, making them the leading provider of secondary education by the end of the period.
これらの減少とは対照的に、コミュニティ・スクールの人気は急上昇した。これらの学校への入学者は、2000年には12%と少数派に過ぎなかったが、2005年には倍以上の32%になり、2009年には58%に急増し、同期間の終わりには中等教育の主要な提供者となった。
ポイント
- ボディ1で下がるをdecrineやdrop(動詞)で表したので、上がるはrise(名詞)を使ってwitnessed a (sharp) riseにしました。上がる/増えるの表現はこちら
- 上がってまた上がる(which/before)の表現は上がって下がる/下がって上がる(こちら)を応用して書きました。
- 12%であるをbe動詞ではなくaccounted forで書きました。—(数字)であるの表現はこちら
- 12%から32%をあえてmore than doubledと書きました。何倍の書き方はこちら
- イントロダクションパラグラフで”most preferred option”と書いたのでここではパラフレイズしてleading providerと書きました。
ボディ2全体
In contrast to these declines, community schools witnessed a sharp rise in popularity. Enrolment in these schools, which accounted for only a small minority at 12% in 2000, more than doubled to 32% by 2005 before surging to 58% in 2009, making them the leading provider of secondary education by the end of the period.
これらの減少とは対照的に、コミュニティ・スクールの人気は急上昇した。これらの学校への入学者は、2000年には12%と少数派に過ぎなかったが、2005年には倍以上の32%になり、2009年には58%に急増し、同期間の終わりには中等教育の主要な提供者となった。
ダイナミック表 その2
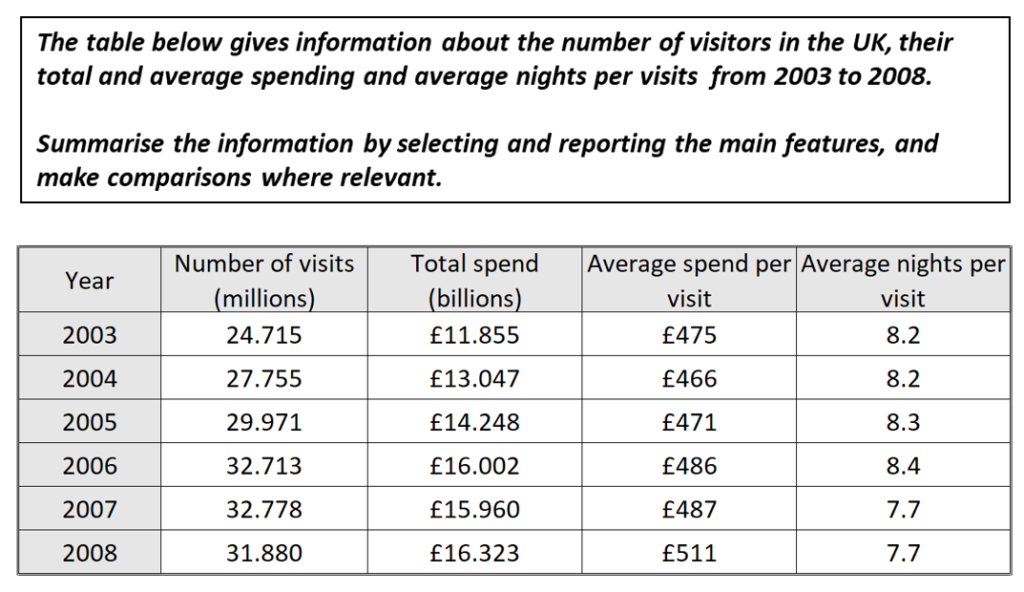
サンプル回答&ポイント解説
サンプル回答
The table provides data on the number of visitors to the UK, their total expenditure, and the duration of their stays from 2003 to 2008. Overall, there were upward trends in most categories, with total spending showing the largest proportional growth. However, the average number of nights per visit exhibited an initial increase before declining towards the end of the period.
表は、2003年から2008年までの英国への訪問者数、支出総額、滞在期間に関するデータを示している。全体的には、ほとんどのカテゴリーで増加傾向が見られ、支出総額は割合的に最大の成長を示した。しかし、訪問1回あたりの平均宿泊数は、最初増加した後、期間の終わりにかけて減少した。
From 2003 to 2006, both the number of visits and total expenditure rose steadily, with visitor numbers increasing by approximately 2–3 million annually from nearly 25 million to almost 32.7 million. Similarly, overall costs grew from roughly £12 billion to £16 billion over the same period. In 2007, the number of visits reached its highest level, with a modest increase of 65,000, while total expenses slightly decreased by £42 million. By 2008, absolute expenditure rebounded to peak at approximately £16.3 billion, although the number of visitors declined to just below 32 million.
2003年から2006年にかけて、訪問者数と支出総額の両方が着実に増加し、訪問者数は約25million人から約32.7million人へと年間約2–3million人増加した。同様に、全体的な費用も同じ期間に約12billionポンドから16billionポンドに増加した。2007年には、訪問者数は65,000人のわずかな増加で最高レベルに達したが、総費用はわずかに0.42billionポンド減少した。2008年には、訪問者数は32million人弱に減少したものの、絶対支出は約16.3billionポンドのピークに回復した。
The average expenditure per visit rose overall, increasing from £475 in 2003 to £511 in 2008, despite a dip to £466 in 2004. Meanwhile, the average length of stay remained stable at 8.2 nights for the first two years before increasing incrementally by 0.1 nights per year until 2006. Thereafter, it dropped abruptly to 7.7 nights in the final two years of the period.
訪問あたりの平均支出は全体的に増加し、2004年には466ポンドに減少したものの、2003年の475ポンドから2008年には511ポンドに増加した。一方、平均滞在日数は最初の2年間は8.2泊で安定していたが、2006年までは毎年0.1泊ずつ増加した。その後、最後の2年間は7.7泊に急減した。
ポイント解説
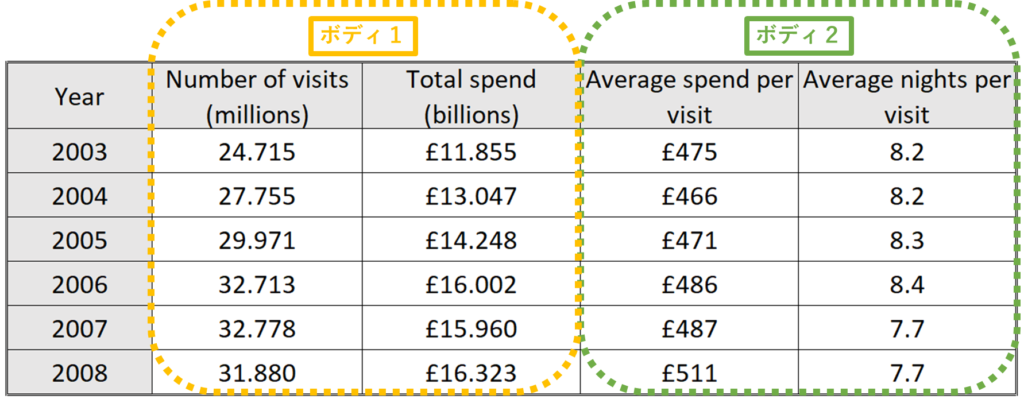
イントロダクション
1文目:問題文のパラフレイズ
- 問題文のパラフレイズについてはこちら
(問題文)The table below gives information about the number of visitors in the UK, their total and average spending and average nights per visits from 2003 to 2008.
⇓ ⇓ ⇓
(パラフレイズ)The table provides data on the number of visitors to the UK, their total expenditure, and the duration of their stays from 2003 to 2008.
表は、2003年から2008年までの英国への訪問者数、支出総額、滞在期間に関するデータを示している。
2文目:Overall
- Overallについてはこちら
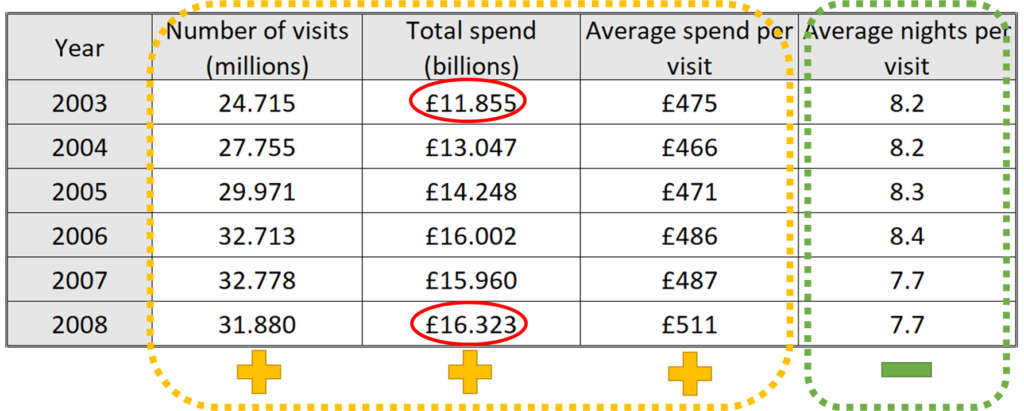
Overall 1文目
全体的に増加傾向にあり(オレンジ)、total spending(£11.855→£16.323)が割合的には一番増えた(赤)。average number of nightsは最初増えたが最終的に減った(緑)。
Overall, there were upward trends in most categories, with total spending showing the largest proportional growth. However, the average number of nights per visit exhibited an initial increase before declining towards the end of the period.
全体的には、ほとんどのカテゴリーで増加傾向が見られ、支出総額は割合的に最大の成長を示した。しかし、訪問1回あたりの平均宿泊数は、最初増加した後、期間の終わりにかけて減少した。
ポイント
イントロダクションパラグラフ全体
The table provides data on the number of visitors to the UK, their total expenditure, and the duration of their stays from 2003 to 2008. Overall, there were upward trends in most categories, with total spending showing the largest proportional growth. However, the average number of nights per visit exhibited an initial increase before declining towards the end of the period.
表は、2003年から2008年までの英国への訪問者数、支出総額、滞在期間に関するデータを示している。全体的には、ほとんどのカテゴリーで増加傾向が見られ、支出総額は割合的に最大の成長を示した。しかし、訪問1回あたりの平均宿泊数は、最初増加した後、期間の終わりにかけて減少した。
ボディ1
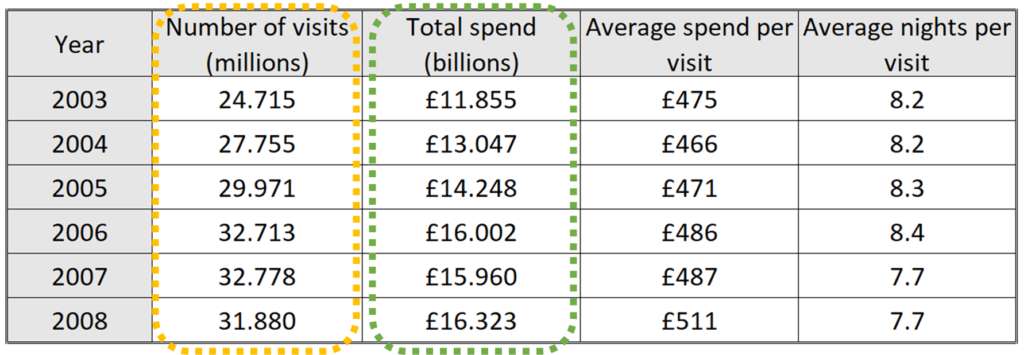
ボディ1 1文目&2文目
number of visitsとtotal spendは2003年から2008年にかけて両方増加し、number of visitsは年間2 million~3 million増加した(オレンジ)。同様にtotal spendも約£12 billionから約£16 billionに増加した(緑)。
From 2003 to 2006, both the number of visits and total expenditure rose steadily, with visitor numbers increasing by approximately 2–3 million annually from nearly 25 million to almost 32.7 million. Similarly, overall costs grew from roughly £12 billion to £16 billion over the same period.
2003年から2006年にかけて、訪問者数と支出総額の両方が着実に増加し、訪問者数は約25million人から約32.7million人へと年間約2–3million人増加した。同様に、全体的な費用も同じ期間に約12billionポンドから16billionポンドに増加した。
ポイント
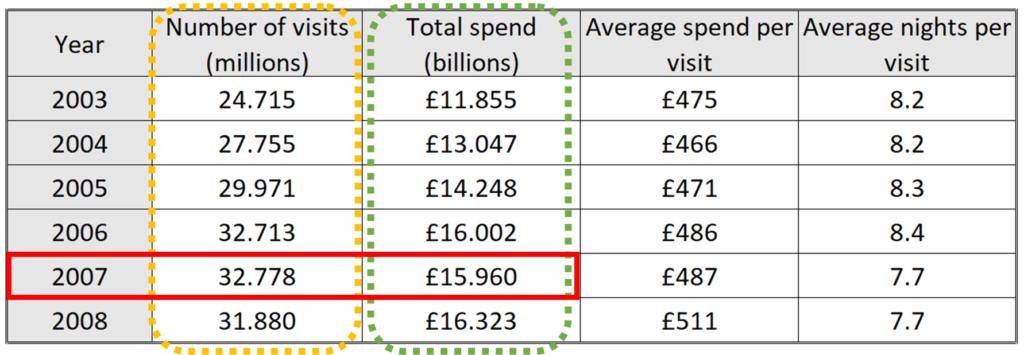
ボディ1 3文目
2007年にはnumber of visitsは65,000(0.065 million)増加して最高値を記録したけれど、total spendは£42 million減少した。
In 2007, the number of visits reached its highest level, with a modest increase of 65,000, while total expenses slightly decreased by £42 million.
2007年には、訪問者数は65,000人のわずかな増加で最高レベルに達したが、総費用はわずかに0.42billionポンド減少した。
ポイント
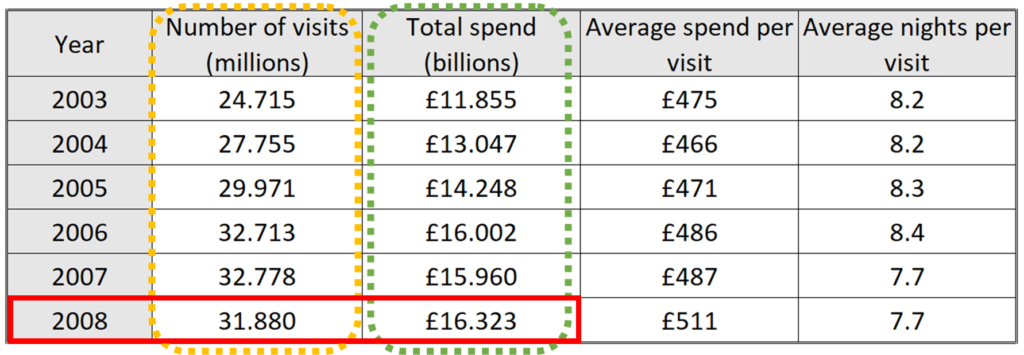
ボディ1 4文目
2008にtotal spendは約16.3 billionで最高値に達したが、number of visitsは32 millionを少し下回る値に下がった。
By 2008, absolute expenditure rebounded to peak at approximately £16.3 billion, although the number of visitors declined to just below 32 million.
2008年には、訪問者数は32million人弱に減少したものの、絶対支出は約16.3billionポンドのピークに回復した。
ポイント
ボディ1全体
From 2003 to 2006, both the number of visits and total expenditure rose steadily, with visitor numbers increasing by approximately 2–3 million annually from nearly 25 million to almost 32.7 million. Similarly, overall costs grew from roughly £12 billion to £16 billion over the same period. In 2007, the number of visits reached its highest level, with a modest increase of 65,000, while total expenses slightly decreased by £42 million. By 2008, absolute expenditure rebounded to peak at approximately £16.3 billion, although the number of visitors declined to just below 32 million.
2003年から2006年にかけて、訪問者数と支出総額の両方が着実に増加し、訪問者数は約25million人から約32.7million人へと年間約2–3million人増加した。同様に、全体的な費用も同じ期間に約12billionポンドから16billionポンドに増加した。2007年には、訪問者数は65,000人のわずかな増加で最高レベルに達したが、総費用はわずかに0.42billionポンド減少した。2008年には、訪問者数は32million人弱に減少したものの、絶対支出は約16.3billionポンドのピークに回復した。
ボディ2
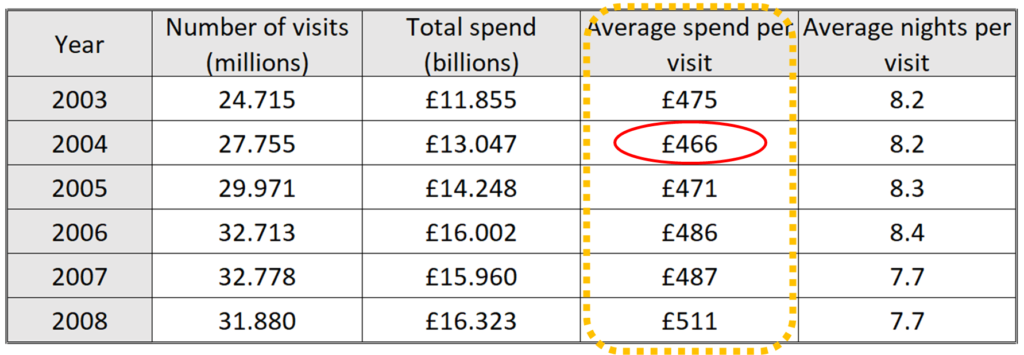
ボディ2 1文目
Average spend per visitは2004年に£466に下がったことはあるものの、2003年に£475から2008年に£511まで毎年上がり続けた。
The average expenditure per visit rose overall, increasing from £475 in 2003 to £511 in 2008, despite a dip to £466 in 2004.
訪問あたりの平均支出は全体的に増加し、2004年には466ポンドに減少したものの、2003年の475ポンドから2008年には511ポンドに増加した。
ポイント
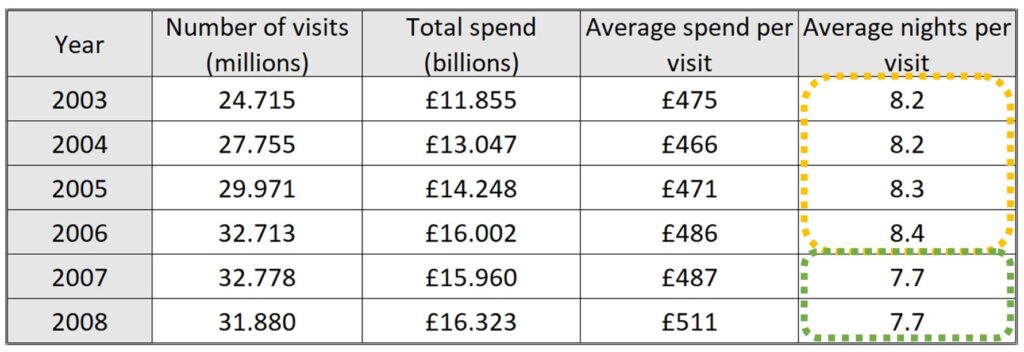
ボディ2 2文目&3文目
Average nights per visitは最初の2年間(2003年と2004年は)8.2で一定で、その後8.3(2005年)、8.4(2006年)と0.1づつ2006年まで増えた(オレンジ)。その後、2007年と2008年は7.7に下がった(緑)。
Meanwhile, the average length of stay remained stable at 8.2 nights for the first two years before increasing incrementally by 0.1 nights per year until 2006. Thereafter, it dropped abruptly to 7.7 nights in the final two years of the period.
一方、平均滞在日数は最初の2年間は8.2泊で安定していたが、2006年までは毎年0.1泊ずつ増加した。その後、最後の2年間は7.7泊に急減した。
ポイント
ボディ2全体
The average expenditure per visit rose overall, increasing from £475 in 2003 to £511 in 2008, despite a dip to £466 in 2004. Meanwhile, the average length of stay remained stable at 8.2 nights for the first two years before increasing incrementally by 0.1 nights per year until 2006. Thereafter, it dropped abruptly to 7.7 nights in the final two years of the period.
訪問あたりの平均支出は全体的に増加し、2004年には466ポンドに減少したものの、2003年の475ポンドから2008年には511ポンドに増加した。一方、平均滞在日数は最初の2年間は8.2泊で安定していたが、2006年までは毎年0.1泊ずつ増加した。その後、最後の2年間は7.7泊に急減した。
スタティック棒グラフ その1
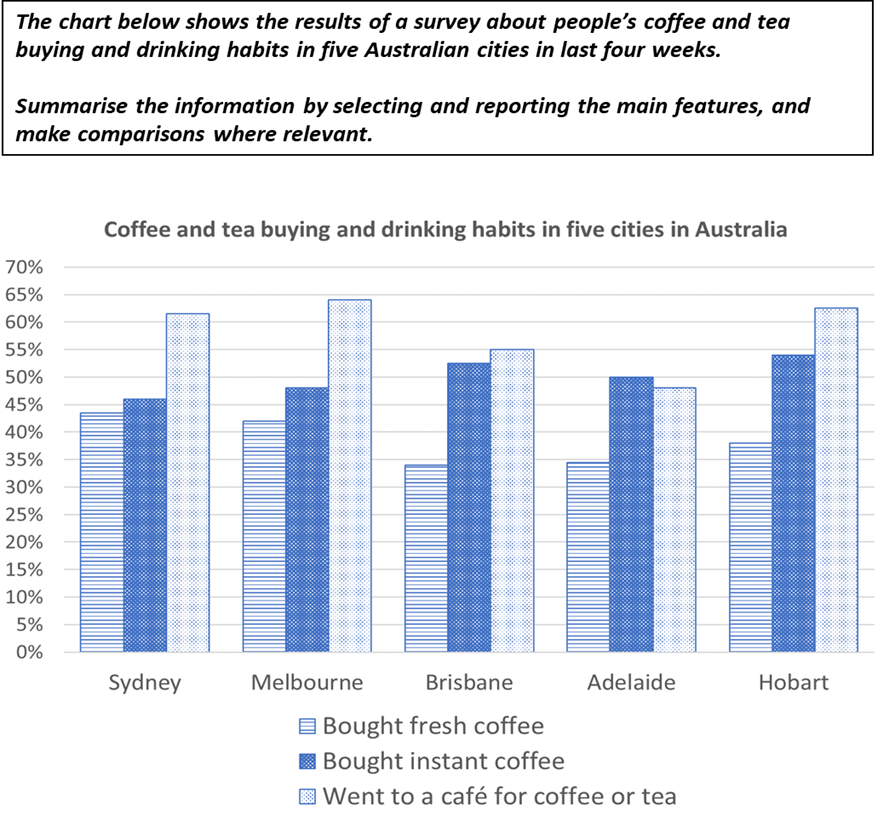
サンプル回答&ポイント解説
サンプル回答
The bar chart depicts the preferences of residents in five Australian cities regarding the purchase and consumption of coffee and tea over the past four weeks. Overall, visiting a café was the most common habit in all cities except Adelaide. Moreover, the percentage of individuals purchasing instant coffee consistently exceeded that of those buying fresh coffee across all cities.
棒グラフは、過去4週間のコーヒーと紅茶の購入と消費に関するオーストラリアの5つの都市の住民の好みを示している。全体的には、アデレードを除くすべての都市で、カフェに行くことが最も一般的な習慣であった。さらに、インスタントコーヒーを購入する人の割合は、すべての都市で一貫してフレッシュコーヒーを購入する人の割合を上回っていた。
Sydney, Melbourne, and Hobart exhibited similar trends, with nearly identical proportions of residents, ranging between 61% and 63%, frequenting cafés. Among these cities, Hobart had the highest percentage of individuals buying instant coffee, at just under 55%, followed by Melbourne at 48% and Sydney at slightly over 45%. In contrast, the proportion of Hobart residents purchasing fresh coffee, at around 38%, was lower than in Melbourne and Sydney, where it stood at approximately 43%.
シドニー、メルボルン、ホバートも同様の傾向を示し、カフェによく行く人の割合は61%から63%の間でほぼ同じであった。これらの都市の中で、インスタントコーヒーを購入する人の割合が最も高かったのはホバートで55%弱、次いでメルボルンの48%、シドニーの45%強であった。一方、ホバートではフレッシュコーヒーを購入する人の割合が約38%と、メルボルンやシドニーの約43%よりも低かった。
In Brisbane and Adelaide, visiting cafés was less popular, with 55% and about 48% of residents, respectively, engaging in this activity. The percentage of individuals purchasing fresh coffee was also similar in these cities, both slightly below 35%. Instant coffee proved to be more popular in Brisbane, with approximately 52% of residents opting for it, while 50% of Adelaide residents chose this option. Notably, Adelaide was unique in that buying instant coffee slightly surpassed visiting cafés in popularity.
ブリスベンとアデレードでは、カフェに行くことはそれほど人気がなく、それぞれ55%と約48%の住民がカフェに行っている。フレッシュコーヒーを購入する人の割合もこれらの都市で同様で、どちらも35%をやや下回った。インスタントコーヒーはブリスベンでより人気があり、約52%の住民がそれを選択したのに対し、アデレードでは50%の住民がこれを選択した。注目すべきは、アデレードではインスタントコーヒーの購入がカフェに行くことをわずかに上回ったことだ。
ポイント解説
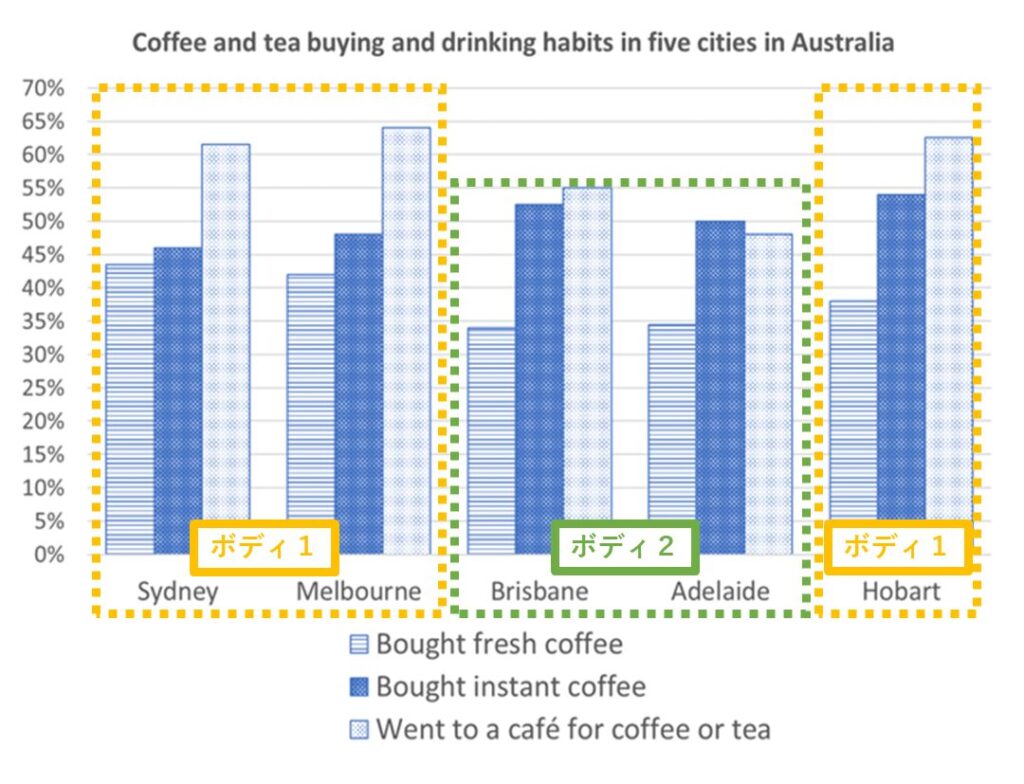
イントロダクション
1文目:問題文のパラフレイズ
- 問題文のパラフレイズについてはこちら
(問題文)The chart below shows the results of a survey about people’s coffee and tea buying and drinking habits in five Australian cities in last four weeks.
⇓ ⇓ ⇓
(パラフレイズ)The bar chart depicts the preferences of residents in five Australian cities regarding the purchase and consumption of coffee and tea over the past four weeks.
棒グラフは、過去4週間のコーヒーと紅茶の購入と消費に関するオーストラリアの5つの都市の住民の好みを示している。
2文目:Overall
- Overallについてはこちら
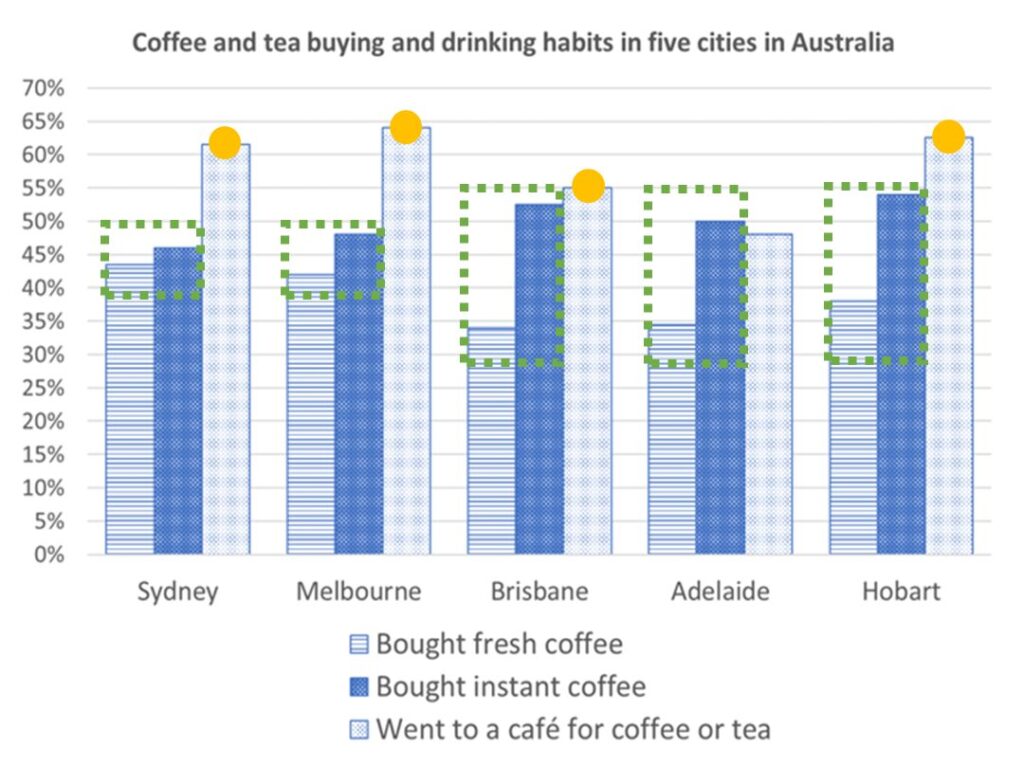
Overall 1文目
Adelaideを除いてどこの都市でもカフェに行く人が一番多い(オレンジ)。さらに全ての都市でinstant coffeeを買う人の数はfresh coffeeを買う人の数より多い(緑)。
Overall, visiting a café was the most common habit in all cities except Adelaide. Moreover, the percentage of individuals purchasing instant coffee consistently exceeded that of those buying fresh coffee across all cities.
全体的には、アデレードを除くすべての都市で、カフェに行くことが最も一般的な習慣であった。さらに、インスタントコーヒーを購入する人の割合は、すべての都市で一貫してフレッシュコーヒーを購入する人の割合を上回っていた。
ポイント
- 例外があっても全体の傾向を書く場合にはexceptが使えます。
イントロダクションパラグラフ全体
The bar chart depicts the preferences of residents in five Australian cities regarding the purchase and consumption of coffee and tea over the past four weeks. Overall, visiting a café was the most common habit in all cities except Adelaide. Moreover, the percentage of individuals purchasing instant coffee consistently exceeded that of those buying fresh coffee across all cities.
棒グラフは、過去4週間のコーヒーと紅茶の購入と消費に関するオーストラリアの5つの都市の住民の好みを示している。全体的には、アデレードを除くすべての都市で、カフェに行くことが最も一般的な習慣であった。さらに、インスタントコーヒーを購入する人の割合は、すべての都市で一貫してフレッシュコーヒーを購入する人の割合を上回っていた。
ボディ1
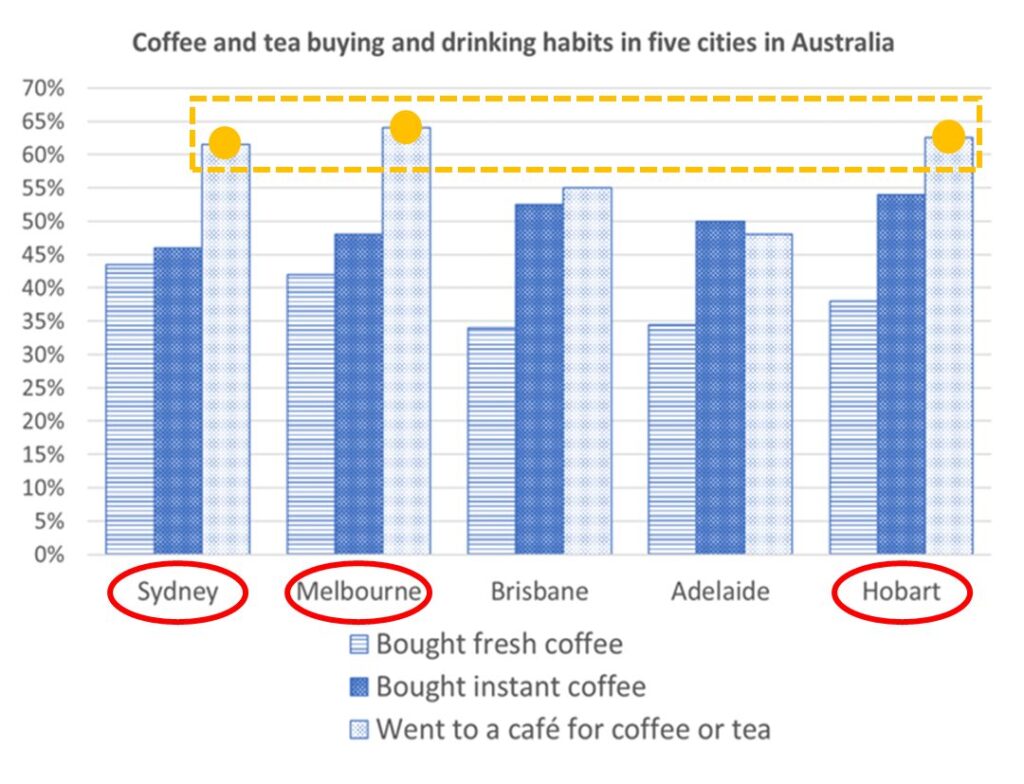
ボディ1 1文目
Sydney, Melbourne, Hobartの3つの都市では61%~63%の人々がカフェに行く点が共通している(オレンジ)。
Sydney, Melbourne, and Hobart exhibited similar trends, with nearly identical proportions of residents, ranging between 61% and 63%, frequenting cafés.
シドニー、メルボルン、ホバートも同様の傾向を示し、カフェによく行く人の割合は61%から63%の間でほぼ同じであった。
ポイント
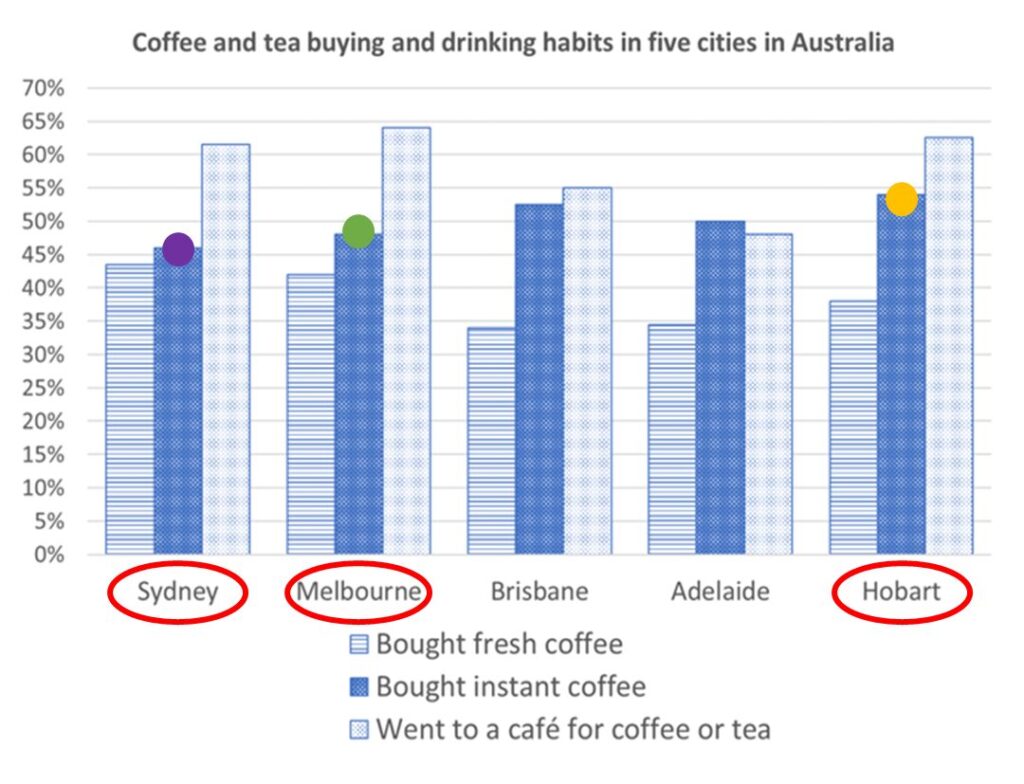
ボディ1 2文目
これらの3つの都市の内、instant coffeeを買う人の割合はHobartが最も高く55%弱(オレンジ)、次いでMelbourneが48%(緑)、Sydneyが45%を少し上回るくらい(紫)だった。
Among these cities, Hobart had the highest percentage of individuals buying instant coffee, at just under 55%, followed by Melbourne at 48% and Sydney at slightly over 45%.
これらの都市の中で、インスタントコーヒーを購入する人の割合が最も高かったのはホバートで55%弱、次いでメルボルンの48%、シドニーの45%強であった。
ポイント
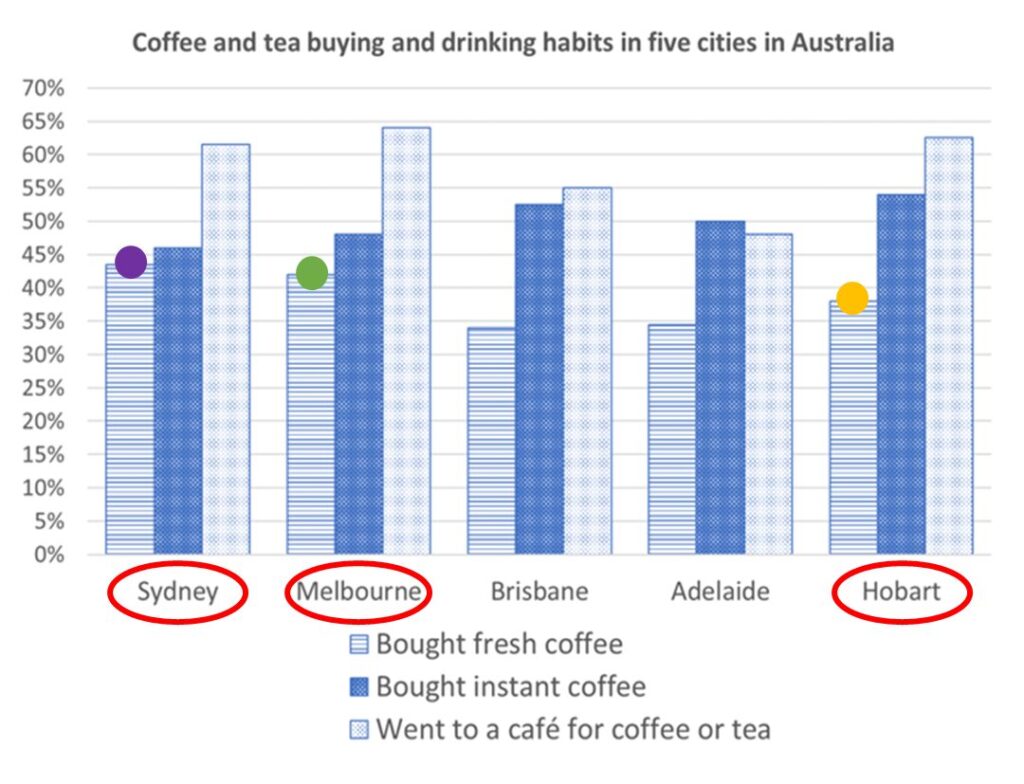
ボディ1 3文目
(instant coffee)とは逆にfresh coffeeを買う人はHobartが約38%で、MelbourneとSydney(両方だいたい43%)よりも少なかった。
In contrast, the proportion of Hobart residents purchasing fresh coffee, at around 38%, was lower than in Melbourne and Sydney, where it stood at approximately 43%.
一方、ホバートではフレッシュコーヒーを購入する人の割合が約38%と、メルボルンやシドニーの約43%よりも低かった。
ポイント
ボディ1全体
Sydney, Melbourne, and Hobart exhibited similar trends, with nearly identical proportions of residents, ranging between 61% and 63%, frequenting cafés. Among these cities, Hobart had the highest percentage of individuals buying instant coffee, at just under 55%, followed by Melbourne at 48% and Sydney at slightly over 45%. In contrast, the proportion of Hobart residents purchasing fresh coffee, at around 38%, was lower than in Melbourne and Sydney, where it stood at approximately 43%.
シドニー、メルボルン、ホバートも同様の傾向を示し、カフェによく行く人の割合は61%から63%の間でほぼ同じであった。これらの都市の中で、インスタントコーヒーを購入する人の割合が最も高かったのはホバートで55%弱、次いでメルボルンの48%、シドニーの45%強であった。一方、ホバートではフレッシュコーヒーを購入する人の割合が約38%と、メルボルンやシドニーの約43%よりも低かった。
ボディ2
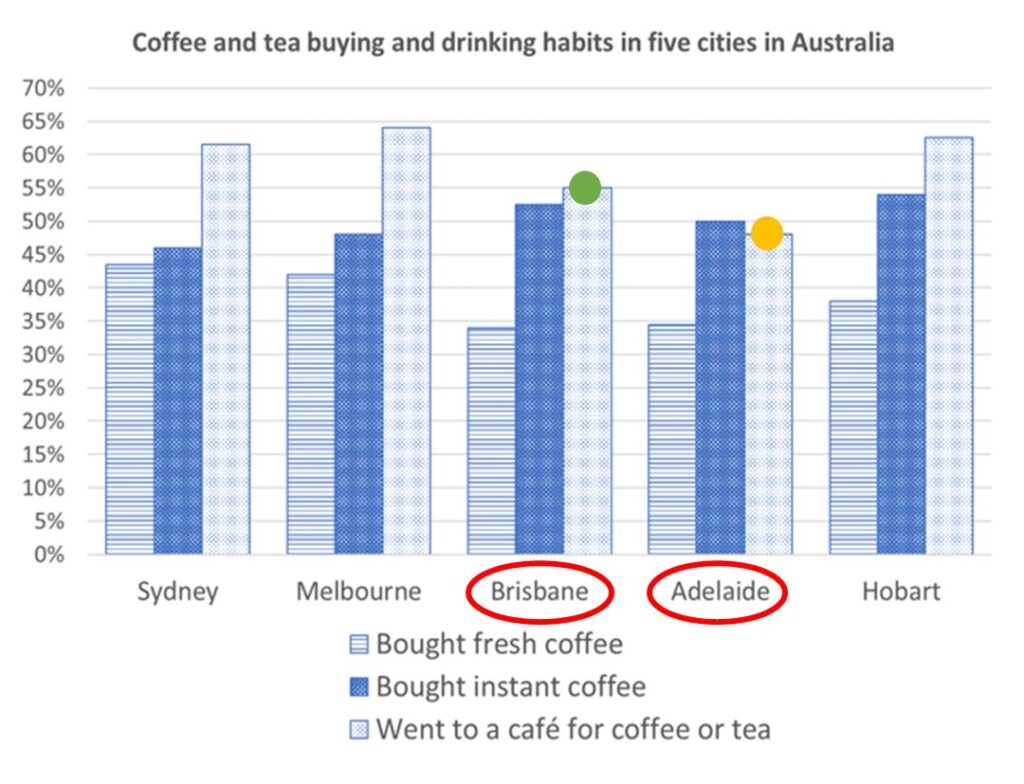
ボディ2 1文目
BrisbaneとAdelaideでカフェに行く人は(ボディ1の3都市よりは少なく)Brisbaneが55%(緑)でAdelaideが約48%だった。
In Brisbane and Adelaide, visiting cafés was less popular, with 55% and about 48% of residents, respectively, engaging in this activity.
ブリスベンとアデレードでは、カフェに行くことはそれほど人気がなく、それぞれ55%と約48%の住民がカフェに行っている。
ポイント
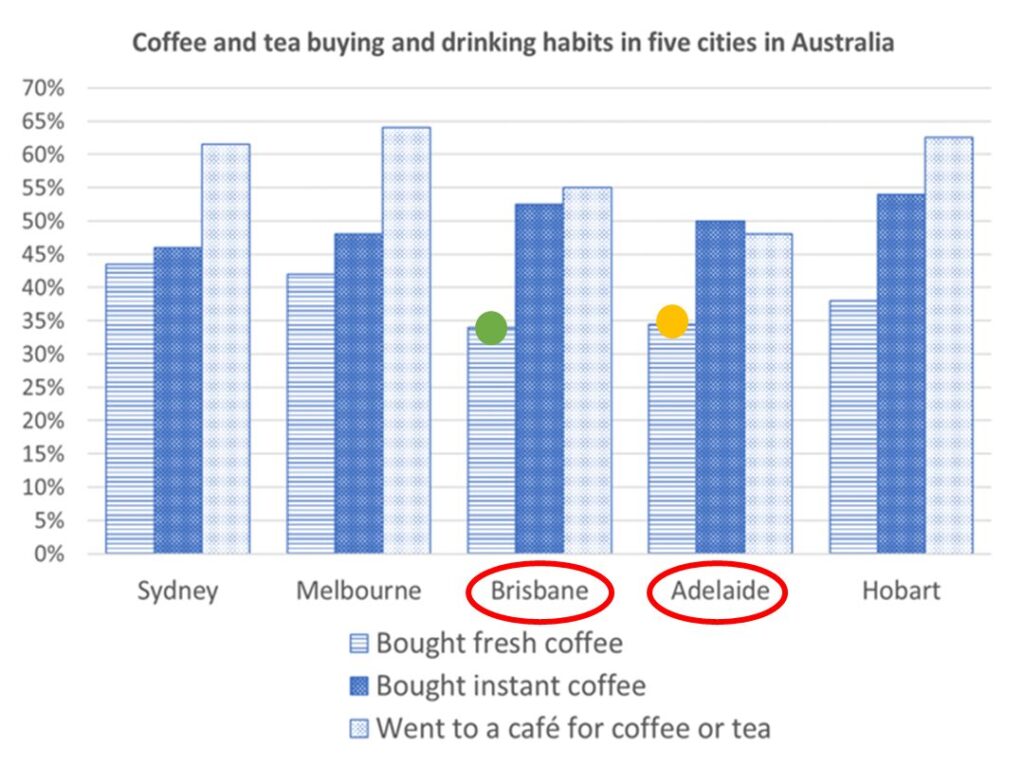
ボディ2 2文目
fresh coffeeを買う人の割合はBrisbaneとAdelaideではほぼ同じで35%くらいだった。
The percentage of individuals purchasing fresh coffee was also similar in these cities, both slightly below 35%.
フレッシュコーヒーを購入する人の割合もこれらの都市で同様で、どちらも35%をやや下回った。
ポイント
- slightly belowなどだいたいの数の表し方はこちら
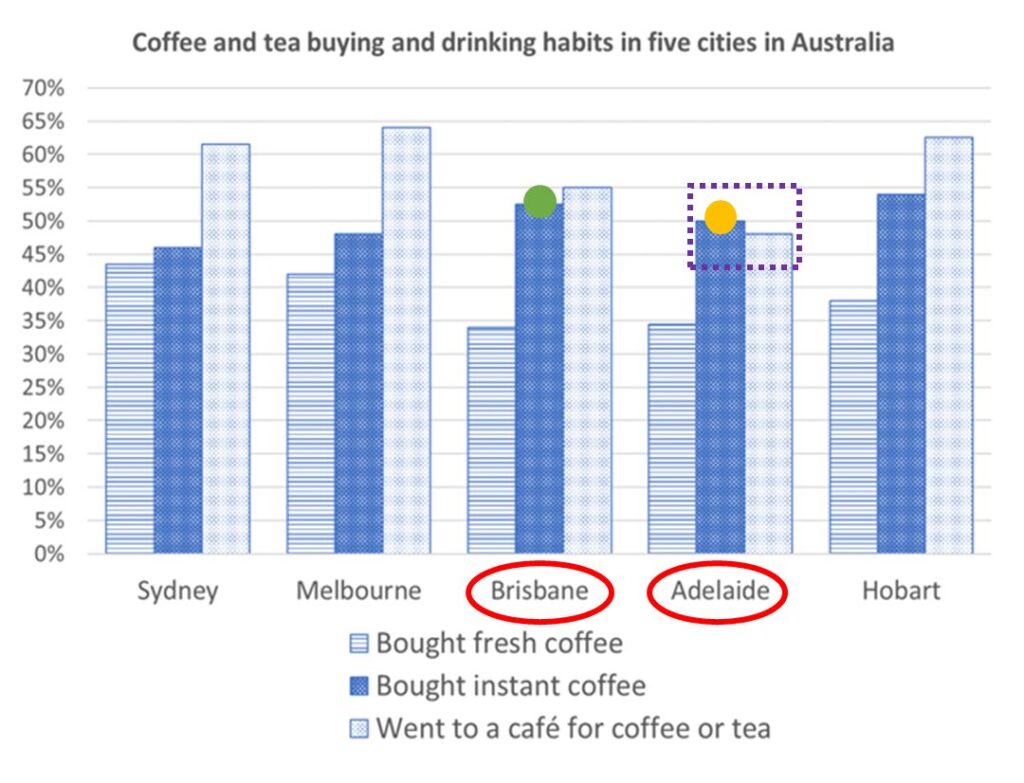
ボディ2 2文目&3文目
instant coffeeをこの2つの都市で比べたとき、Brisbaneの方が人気で52%(緑)、一方でAdelaideは50%(オレンジ)だった。Adelaideは他の都市と比べてinstant coffeeを買う人の方がカフェに行く人の数より多かった(紫)。
Instant coffee proved to be more popular in Brisbane, with approximately 52% of residents opting for it, while 50% of Adelaide residents chose this option. Notably, Adelaide was unique in that buying instant coffee slightly surpassed visiting cafés in popularity.
インスタントコーヒーはブリスベンでより人気があり、約52%の住民がそれを選択したのに対し、アデレードでは50%の住民がこれを選択した。注目すべきは、アデレードではインスタントコーヒーの購入がカフェに行くことをわずかに上回ったことだ。
ポイント
- 付帯状況のwithを使って数字を追加しました。数値の説明の表し方はこちら
- whileを使って対比表現をしました。
- イントロダクションパラグラフでexceptで表した例外(Adelaide)をここではunique inで表現しました。
ボディ2全体
In Brisbane and Adelaide, visiting cafés was less popular, with 55% and about 48% of residents, respectively, engaging in this activity. The percentage of individuals purchasing fresh coffee was also similar in these cities, both slightly below 35%. Instant coffee proved to be more popular in Brisbane, with approximately 52% of residents opting for it, while 50% of Adelaide residents chose this option. Notably, Adelaide was unique in that buying instant coffee slightly surpassed visiting cafés in popularity.
ブリスベンとアデレードでは、カフェに行くことはそれほど人気がなく、それぞれ55%と約48%の住民がカフェに行っている。フレッシュコーヒーを購入する人の割合もこれらの都市で同様で、どちらも35%をやや下回った。インスタントコーヒーはブリスベンでより人気があり、約52%の住民がそれを選択したのに対し、アデレードでは50%の住民がこれを選択した。注目すべきは、アデレードではインスタントコーヒーの購入がカフェに行くことをわずかに上回ったことだ。
スタティック棒グラフ その2
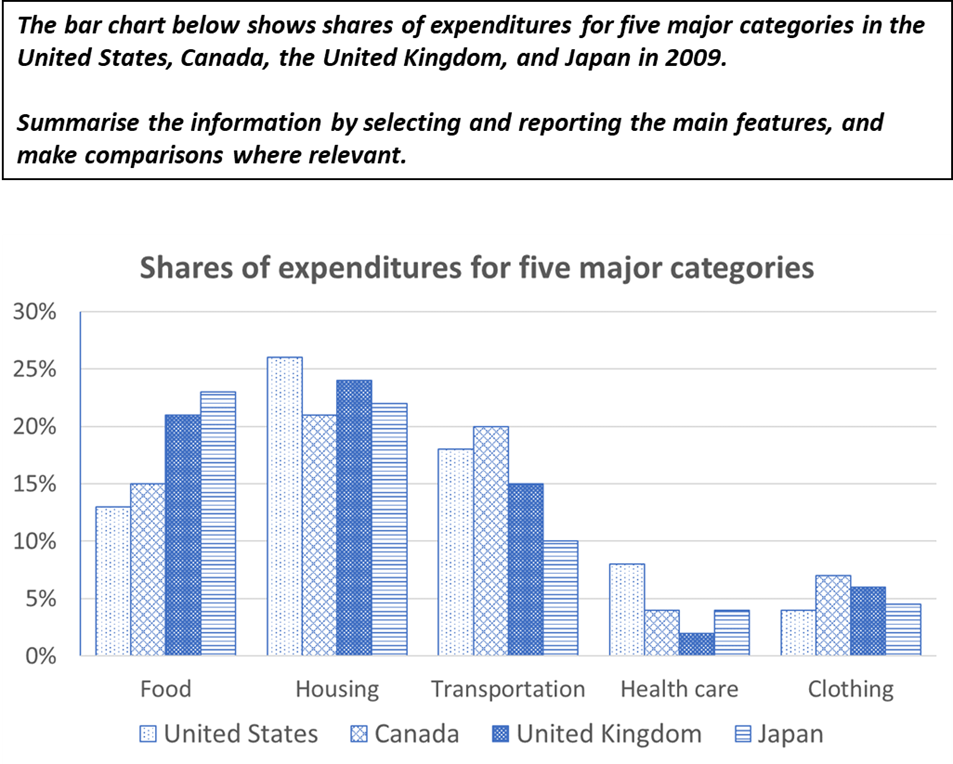
サンプル回答&ポイント解説
サンプル回答
The bar chart illustrates the distribution of expenditure across five lifestyle categories in four countries in 2009. Overall, housing, food, and transportation constituted the largest portions of spending, while healthcare and clothing accounted for smaller shares, with notable variations between the countries.
棒グラフは、2009年の4カ国における5つのライフスタイルカテゴリーの支出の分布を示している。全体では、住居、食料、交通費が支出の大部分を占め、医療と衣料品の割合は小さく、国によって顕著な違いがある。
Housing expenses were the highest across all countries, ranging from just over 20% in Canada to slightly more than a quarter in the United States. The United Kingdom and Japan fell between these extremes, at approximately 24% and 22%, respectively. Regarding food, Japan recorded the highest proportion at around 23%, followed by the United Kingdom at slightly over 20%. In contrast, food expenditure in Canada and the United States was significantly lower, at 15% and just under 13%, respectively. Transportation costs were highest in Canada, comprising one-fifth of total spending, which was double the proportion in Japan. In the United States and the United Kingdom, transportation accounted for 18% and 15%, respectively.
住居費はすべての国で最も高く、カナダの20%強から米国の1/4(=25%)強まで幅があった。英国と日本は、それぞれ約24%と22%で、両者(カナダと米国)の間にあった。食料については、日本が約23%で最も高く、英国が20%強で続いた。一方、カナダと米国の食料費は、それぞれ15%と13%弱と大幅に低かった。交通費が最も高かったのはカナダで全体の1/5(20%)を占め、日本の2倍だった。米国は18%、英国は15%だった。
Healthcare expenditure was markedly higher in the United States, at nearly 8%, whereas all other countries allocated less than 5% to medical expenses. For clothing, the differences between countries were less pronounced. Canadians spent the most at 7%, followed by the United Kingdom at 6%, Japan at nearly 5%, and the United States at 4%, the lowest among the four nations.
医療費は米国が8%近くと突出して高く、他の国は5%以下だった。衣料品は国による差はそれほど大きくなかった。カナダが7%で最も多く、英国が6%、日本が5%近く、米国が4%と4カ国の中で最も低かった。
ポイント解説
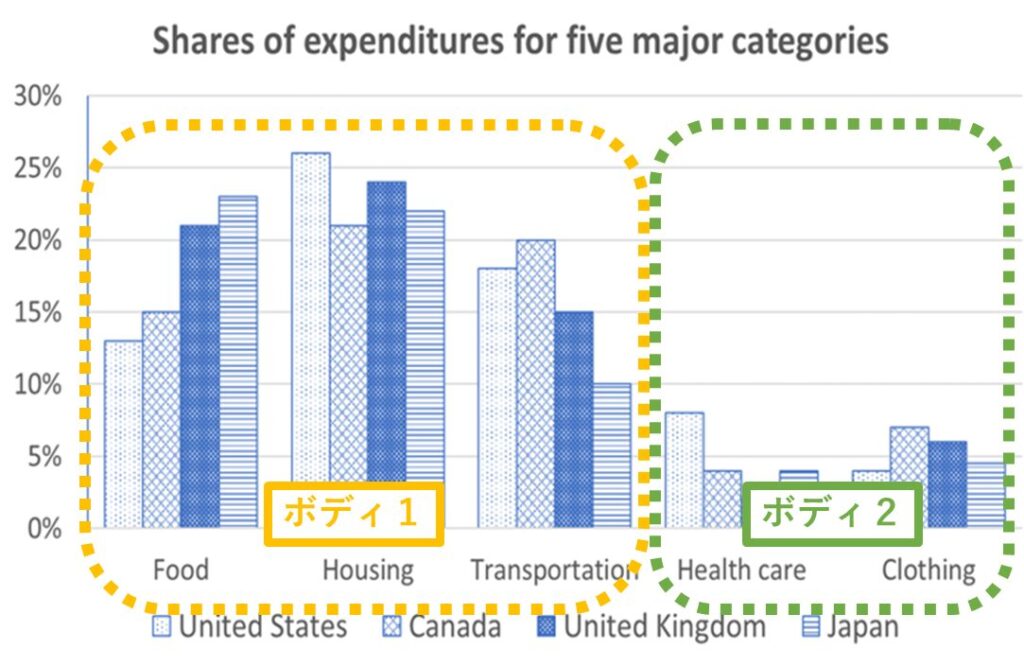
イントロダクション
1文目:問題文のパラフレイズ
- 問題文のパラフレイズについてはこちら
(問題文)The bar chart below shows shares of expenditures for five major categories in the United States, Canada, the United Kingdom, and Japan in 2009.
⇓ ⇓ ⇓
(パラフレイズ)The bar chart illustrates the distribution of expenditure across five lifestyle categories in four countries in 2009.
棒グラフは、2009年の4カ国における5つのライフスタイルカテゴリーの支出の分布を示している。
2文目:Overall
- Overallについてはこちら
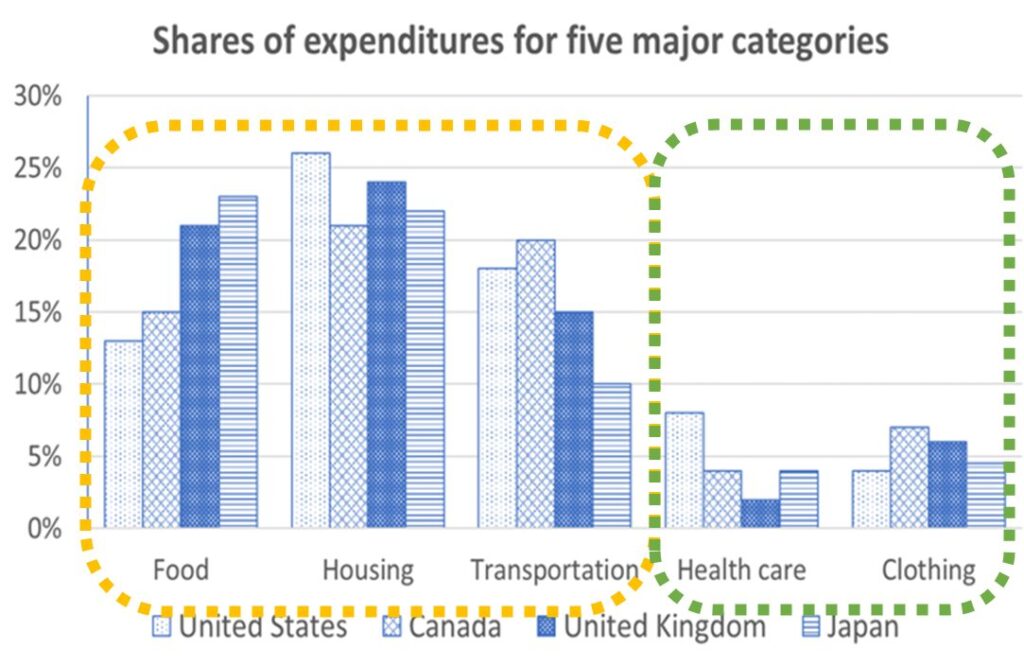
Overall 1文目
housing, food, transportationがどこの国でも多くの割合を占め(オレンジ)、healthcare, clothingの割合は少ない(緑)。
Overall, housing, food, and transportation constituted the largest portions of spending, while healthcare and clothing accounted for smaller shares, with notable variations between the countries.
全体では、住居、食料、交通費が支出の大部分を占め、医療と衣料品の割合は小さく、国によって顕著な違いがある。
ポイント
- whileを使って対比表現をしました。Overallでの対比表現はこちら
イントロダクションパラグラフ全体
The bar chart illustrates the distribution of expenditure across five lifestyle categories in four countries in 2009. Overall, housing, food, and transportation constituted the largest portions of spending, while healthcare and clothing accounted for smaller shares, with notable variations between the countries.
棒グラフは、2009年の4カ国における5つのライフスタイルカテゴリーの支出の分布を示している。全体では、住居、食料、交通費が支出の大部分を占め、医療と衣料品の割合は小さく、国によって顕著な違いがある。
ボディ1
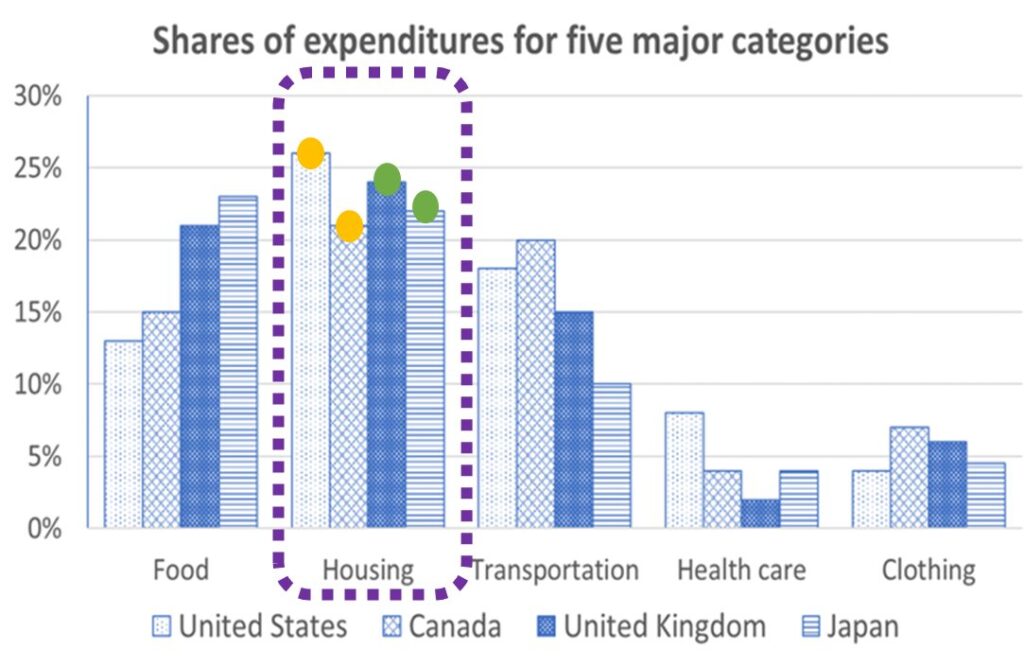
ボディ1 1文目&2文目
Housingに関する出費は他の出費より多く、Canadaの20%強~United Statesの25%強の間で(オレンジ)、United KingdomとJapanはそれぞれ24%と22%(緑)でCandaとUnited Statesの間だった。
Housing expenses were the highest across all countries, ranging from just over 20% in Canada to slightly more than a quarter in the United States. The United Kingdom and Japan fell between these extremes, at approximately 24% and 22%, respectively.
住居費はすべての国で最も高く、カナダの20%強から米国の1/4(=25%)強まで幅があった。英国と日本は、それぞれ約24%と22%で、両者(カナダと米国)の間にあった。
ポイント
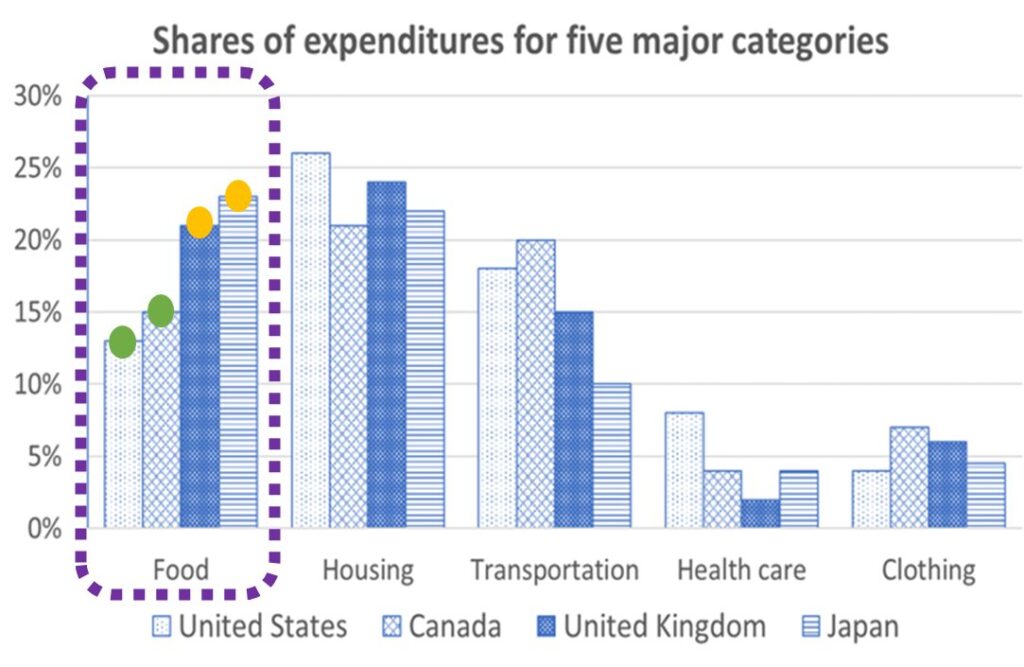
ボディ1 3文目&4文目
Foodへの出費に関しては、Japanが23%で最も多く次いでUnited Kingdomが約23%(オレンジ)だった。CanadaとUnited Statesはそれぞれ15%、13%を少し下回る値(緑)だった。
Regarding food, Japan recorded the highest proportion at around 23%, followed by the United Kingdom at slightly over 20%. In contrast, food expenditure in Canada and the United States was significantly lower, at 15% and just under 13%, respectively.
食料については、日本が約23%で最も高く、英国が20%強で続いた。一方、カナダと米国の食料費は、それぞれ15%と13%弱と大幅に低かった。
ポイント
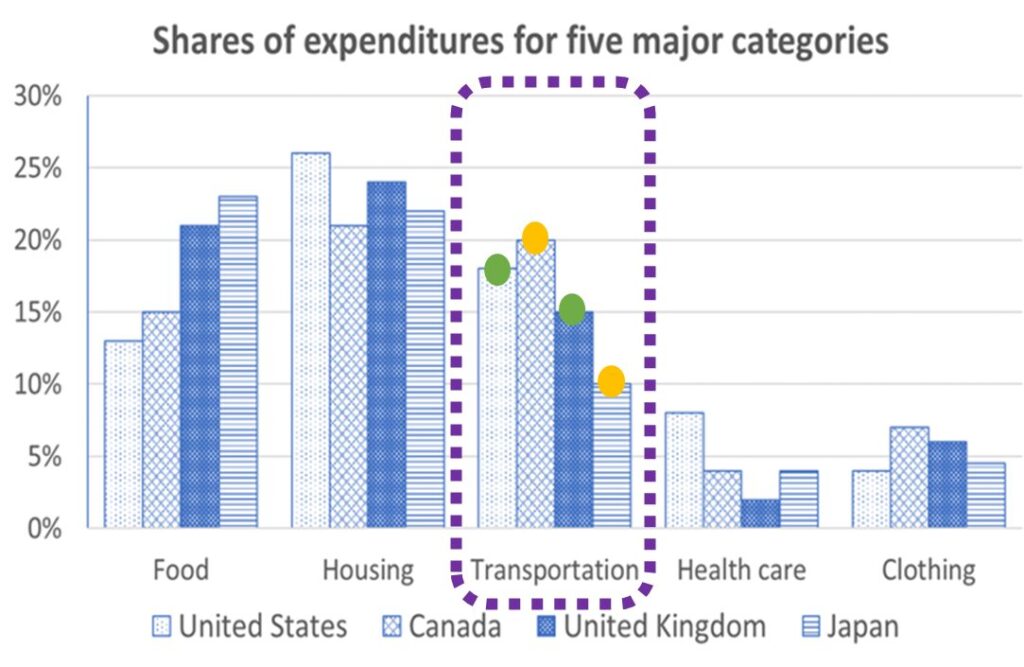
ボディ1 5文目
Transportationへの出費はCanadaで最も高く20%で日本(10%)の2倍(オレンジ)だった。United StatesとUnited Kingdomではそれぞれ18%と15%(緑)だった。
Transportation costs were highest in Canada, comprising one-fifth of total spending, which was double the proportion in Japan. In the United States and the United Kingdom, transportation accounted for 18% and 15%, respectively.
交通費が最も高かったのはカナダで全体の1/5(20%)を占め、日本の2倍だった。米国は18%、英国は15%だった。
ポイント
ボディ1全体
Housing expenses were the highest across all countries, ranging from just over 20% in Canada to slightly more than a quarter in the United States. The United Kingdom and Japan fell between these extremes, at approximately 24% and 22%, respectively. Regarding food, Japan recorded the highest proportion at around 23%, followed by the United Kingdom at slightly over 20%. In contrast, food expenditure in Canada and the United States was significantly lower, at 15% and just under 13%, respectively. Transportation costs were highest in Canada, comprising one-fifth of total spending, which was double the proportion in Japan. In the United States and the United Kingdom, transportation accounted for 18% and 15%, respectively.
住居費はすべての国で最も高く、カナダの20%強から米国の1/4(=25%)強まで幅があった。英国と日本は、それぞれ約24%と22%で、両者(カナダと米国)の間にあった。食料については、日本が約23%で最も高く、英国が20%強で続いた。一方、カナダと米国の食料費は、それぞれ15%と13%弱と大幅に低かった。交通費が最も高かったのはカナダで全体の1/5(20%)を占め、日本の2倍だった。米国は18%、英国は15%だった。
ボディ2
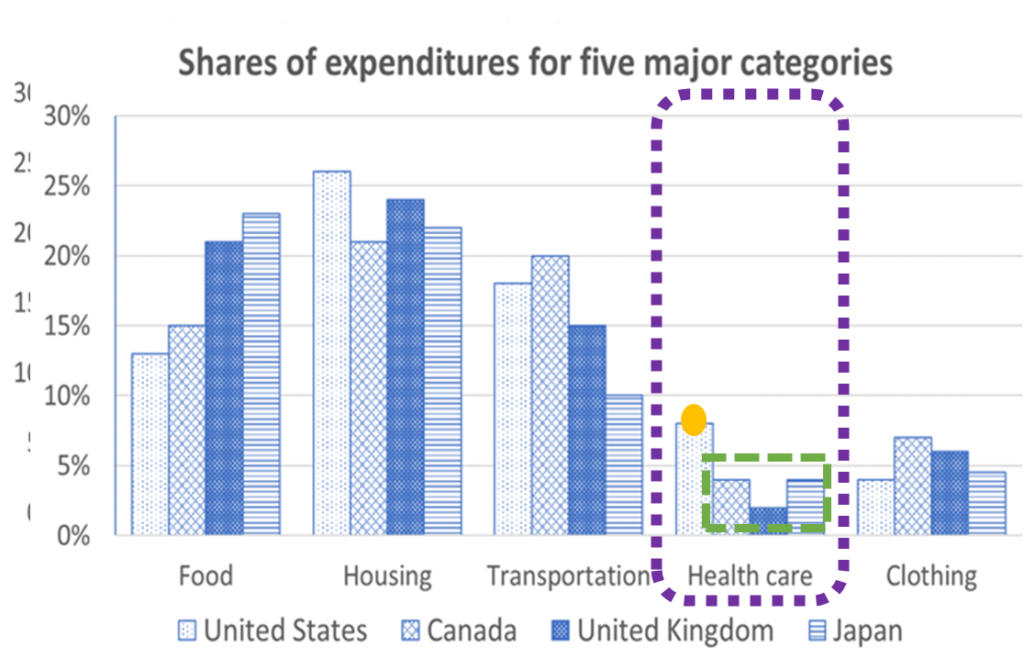
ボディ2 1文目
Healthcareの出費はUnited Statesが他の国より高く8%を占め(オレンジ)、他の国は5%未満(緑)だった。
Healthcare expenditure was markedly higher in the United States, at nearly 8%, whereas all other countries allocated less than 5% to medical expenses.
医療費は米国が8%近くと突出して高く、他の国は5%以下だった。
ポイント
- 比較級(higher)を使ってUnited Statesと他の国を比較しました。比較級についてはこちら
- whereasを使ってUnited Statesと他の国を対比しました。
- Healthcare expenditureをmedical expensesにパラフレイズしました。
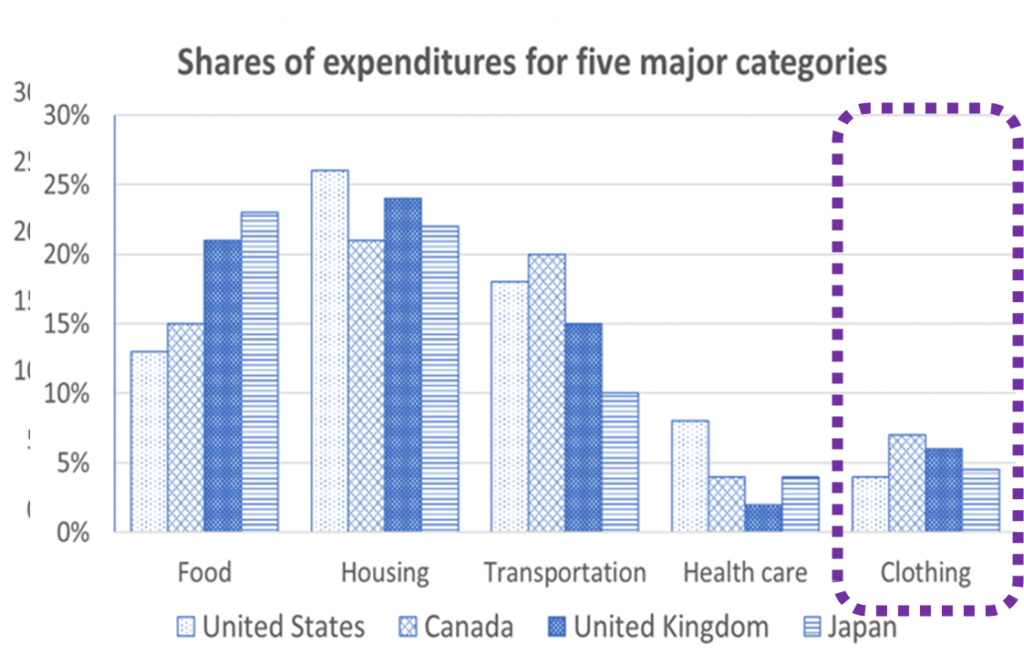
ボディ2 2文目&3文目
clothingに関しては他のカテゴリーほど国別の違いがない。Canada spentが一番多く7%, 次いでUnited Kingdomが6%, Japanが5%, United Statesは最も低く4%だった。
For clothing, the differences between countries were less pronounced. Canadians spent the most at 7%, followed by the United Kingdom at 6%, Japan at nearly 5%, and the United States at 4%, the lowest among the four nations.
衣料品は国による差はそれほど大きくなかった。カナダが7%で最も多く、英国が6%、日本が5%近く、米国が4%と4カ国の中で最も低かった。
ポイント
- Canadaに次いで(followed by)United Kingdomのように1番、2番、3番の表し方はこちら
ボディ2全体
Healthcare expenditure was markedly higher in the United States, at nearly 8%, whereas all other countries allocated less than 5% to medical expenses. For clothing, the differences between countries were less pronounced. Canadians spent the most at 7%, followed by the United Kingdom at 6%, Japan at nearly 5%, and the United States at 4%, the lowest among the four nations.
医療費は米国が8%近くと突出して高く、他の国は5%以下だった。衣料品は国による差はそれほど大きくなかった。カナダが7%で最も多く、英国が6%、日本が5%近く、米国が4%と4カ国の中で最も低かった。
スタティック円グラフ その1
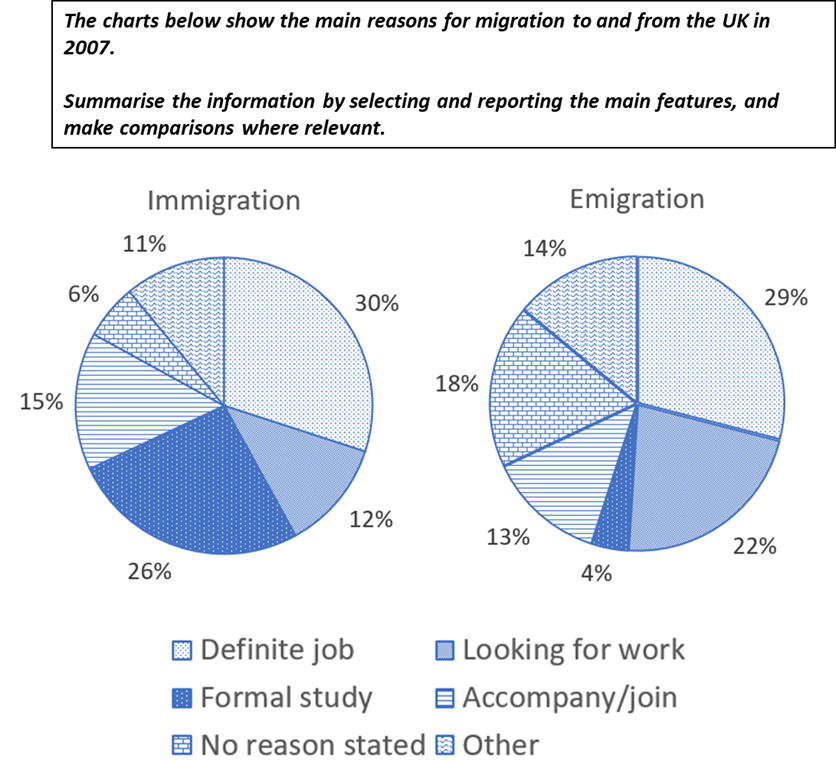
サンプル回答&ポイント解説
サンプル回答
The pie charts present the primary reasons for immigration to and emigration from the United Kingdom in 2007. Overall, immigration was predominantly motivated by work and study, whereas emigration was largely work-related, with study being a less common reason. The percentage of individuals accompanying others was comparable in both cases.
円グラフは、2007年の英国への移民(Immigration)と英国からの移民(Emigration)の主な理由を示している。全体的に、Immigrationは仕事と勉強が主な動機であるのに対し、Emigrationは主に仕事に関連しており、勉強はあまり一般的ではない。同伴の割合は、どちらの場合も同程度であった。
Work-related factors, including specific job offers or the search for employment, accounted for 42% of immigration and 51% of emigration. Approximately 30% of both immigrants and emigrants moved for defined jobs, although a notable disparity existed regarding job-seeking, with 12% of immigrants compared to 22% of emigrants citing this as their reason. Formal study attracted 26% of immigrants to the UK, a proportion nearly seven times greater than the 4% of emigrants who left the UK for education.
特定の仕事のオファーや仕事探しを含む仕事関連の要因は、Immigrationの42%、Emigrationの51%を占めた。Immigration、Emigrationともに約30%が特定の仕事のために移動したが、仕事探しに関しては、Immigrationの12%が仕事探しを理由に挙げているのに対し、Emigrationの22%は仕事探しを理由に挙げており、顕著な差があった。正規の教育を受けるために英国に移住(Immigrate)した人の割合は26%で、教育を受けるために英国を離れた人の割合 (4%) の7倍に近い。
The proportion of individuals migrating to accompany others was similar, at 15% for immigrants and 13% for emigrants. Additionally, 6% of immigrants moved to the UK for unspecified reasons, compared to a significantly higher 18% of emigrants leaving without a specific reason. Other motives constituted a relatively small share, with 11% of immigration and 14% of emigration attributed to miscellaneous factors.
他の人に同行するために移住した人の割合も同様で、移民が15%、移民が13%だった。さらに、移民の6%が理由を特定せずに英国に移住したのに対し、特定の理由なしに英国を離れた人の割合は18%と大幅に高かった。その他の理由は比較的少なく、移民の11%、移民の14%がその他の要因によるものだった。
ポイント解説
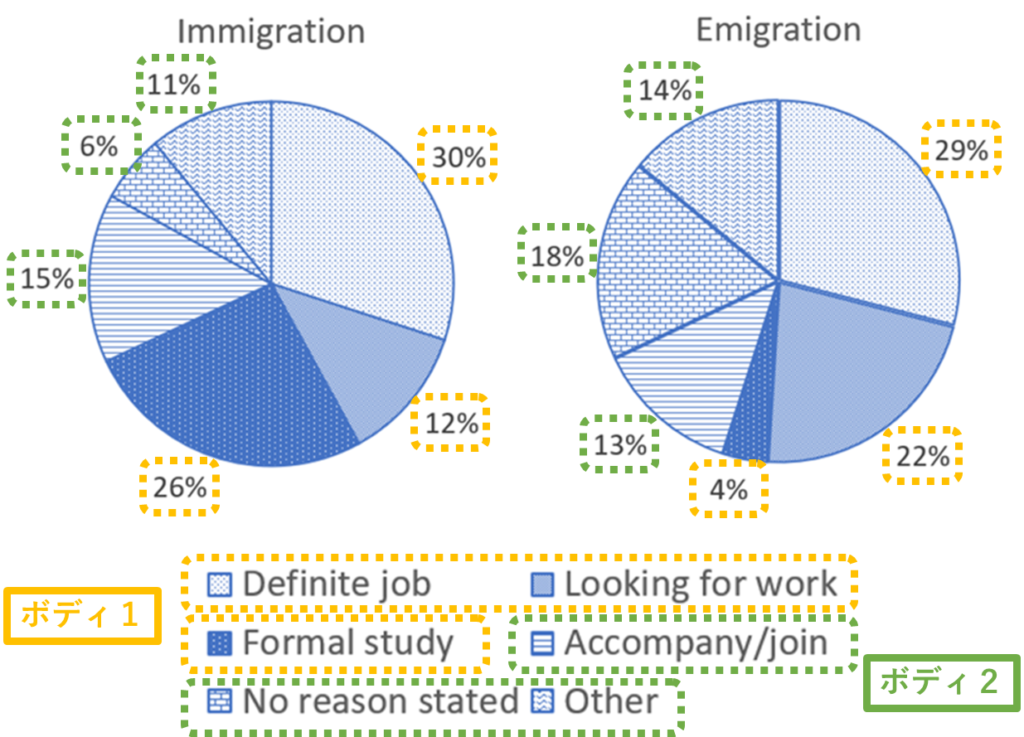
イントロダクション
1文目:問題文のパラフレイズ
- 問題文のパラフレイズについてはこちら
(問題文)The charts below show the main reasons for migration to and from the UK in 2007.
⇓ ⇓ ⇓
(パラフレイズ)The pie charts present the primary reasons for immigration to and emigration from the United Kingdom in 2007.
円グラフは、2007年の英国への移民(Immigration)と英国からの移民(Emigration)の主な理由を示している。
2文目:Overall
- Overallについてはこちら
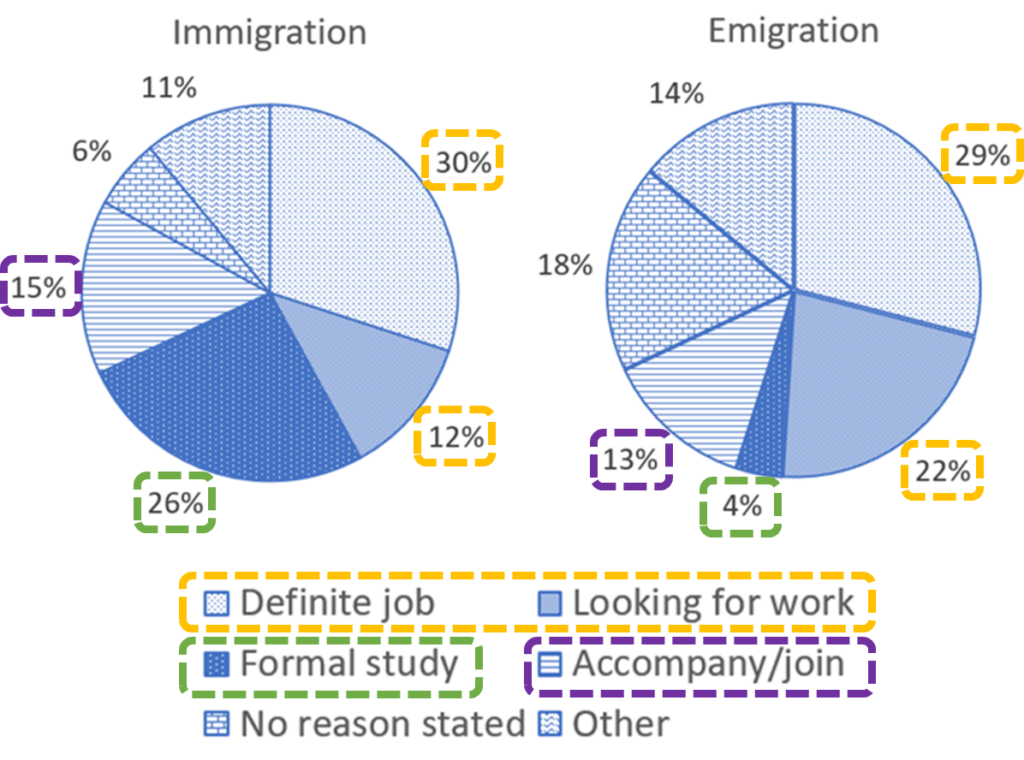
Overall 1文目
immigrationは主に仕事と勉強が目的(仕事関係:30%+12%、勉強:15%)であるのに対してemigrationは主に仕事が目的(仕事関係:29%+22%)で勉強(4%)は少ない。immigration(15%)もemigration(13%)もaccompanying others(結婚など)の割合は少ない。
Overall, immigration was predominantly motivated by work and study, whereas emigration was largely work-related, with study being a less common reason. The percentage of individuals accompanying others was comparable in both cases.
全体的に、Immigrationは仕事と勉強が主な動機であるのに対し、Emigrationは主に仕事に関連しており、勉強はあまり一般的ではない。同伴の割合は、どちらの場合も同程度であった。
ポイント
イントロダクションパラグラフ全体
The pie charts present the primary reasons for immigration to and emigration from the United Kingdom in 2007. Overall, immigration was predominantly motivated by work and study, whereas emigration was largely work-related, with study being a less common reason. The percentage of individuals accompanying others was comparable in both cases.
円グラフは、2007年の英国への移民(Immigration)と英国からの移民(Emigration)の主な理由を示している。全体的に、Immigrationは仕事と勉強が主な動機であるのに対し、Emigrationは主に仕事に関連しており、勉強はあまり一般的ではない。同伴の割合は、どちらの場合も同程度であった。
ボディ1
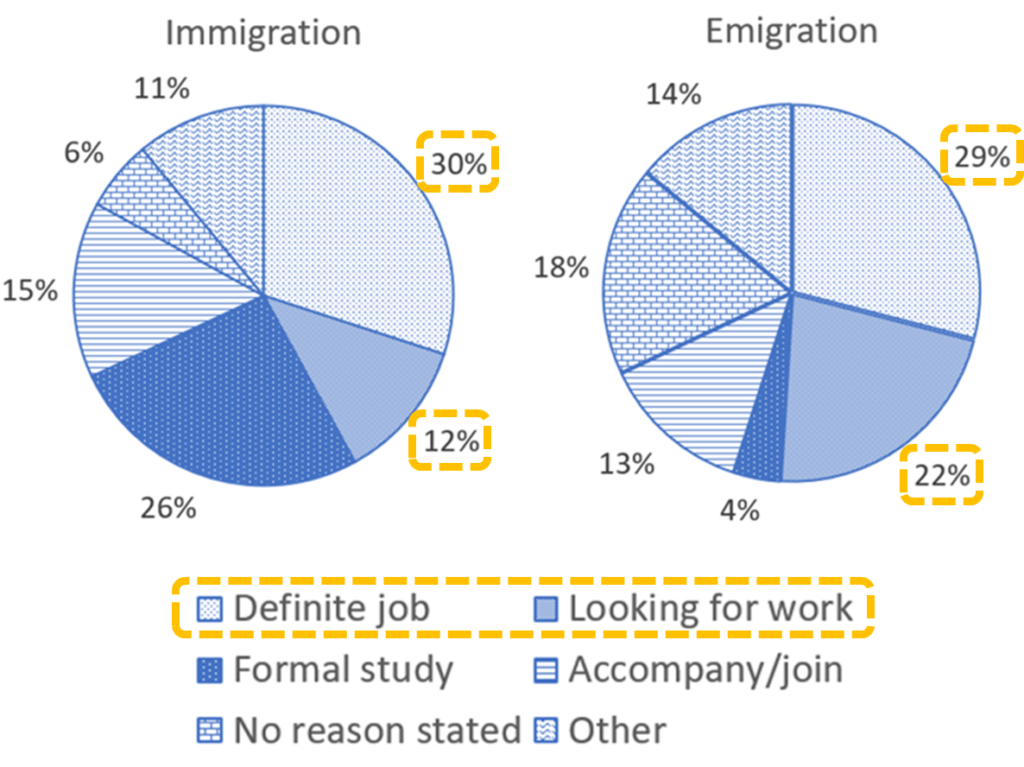
ボディ1 1文目
仕事に関係した理由(Defined jobとLooking for work)の合計はimmigrationで42%(30%+12%)でemigrationで51%(29%+22%)を占める。
Work-related factors, including specific job offers or the search for employment, accounted for 42% of immigration and 51% of emigration.
特定の仕事のオファーや仕事探しを含む仕事関連の要因は、Immigrationの42%、Emigrationの51%を占めた。
ポイント
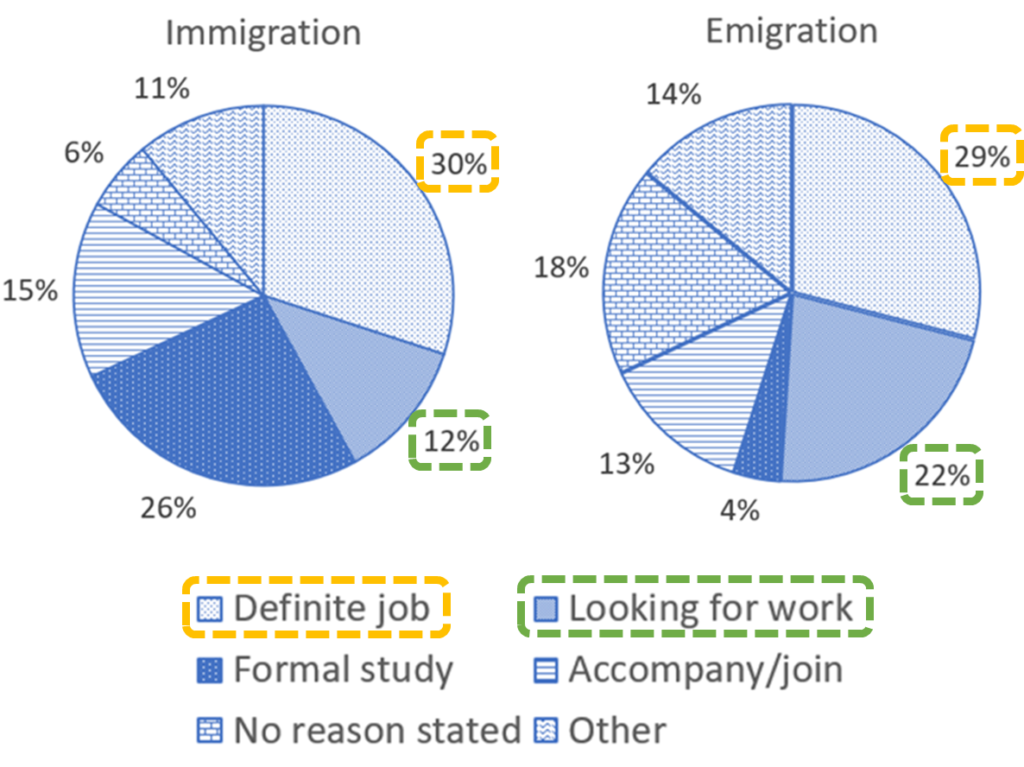
ボディ1 2文目
immigrationもemigrationも約30%が特定の仕事のために移動し(オレンジ)、仕事を求めて移動した人の数にはimmigrationが12%、emigrationが22%と違い(緑)がある。
Approximately 30% of both immigrants and emigrants moved for defined jobs, although a notable disparity existed regarding job-seeking, with 12% of immigrants compared to 22% of emigrants citing this as their reason.
Immigration、Emigrationともに約30%が特定の仕事のために移動したが、仕事探しに関しては、Immigrationの12%が仕事探しを理由に挙げているのに対し、Emigrationの22%は仕事探しを理由に挙げており、顕著な差があった。
ポイント
- immigrationもemigrationをimmigrantsとemigrantsに変えて表現しました。
- 付帯状況のwithを使って情報を追加しました。数値の説明の表現方法はこちら
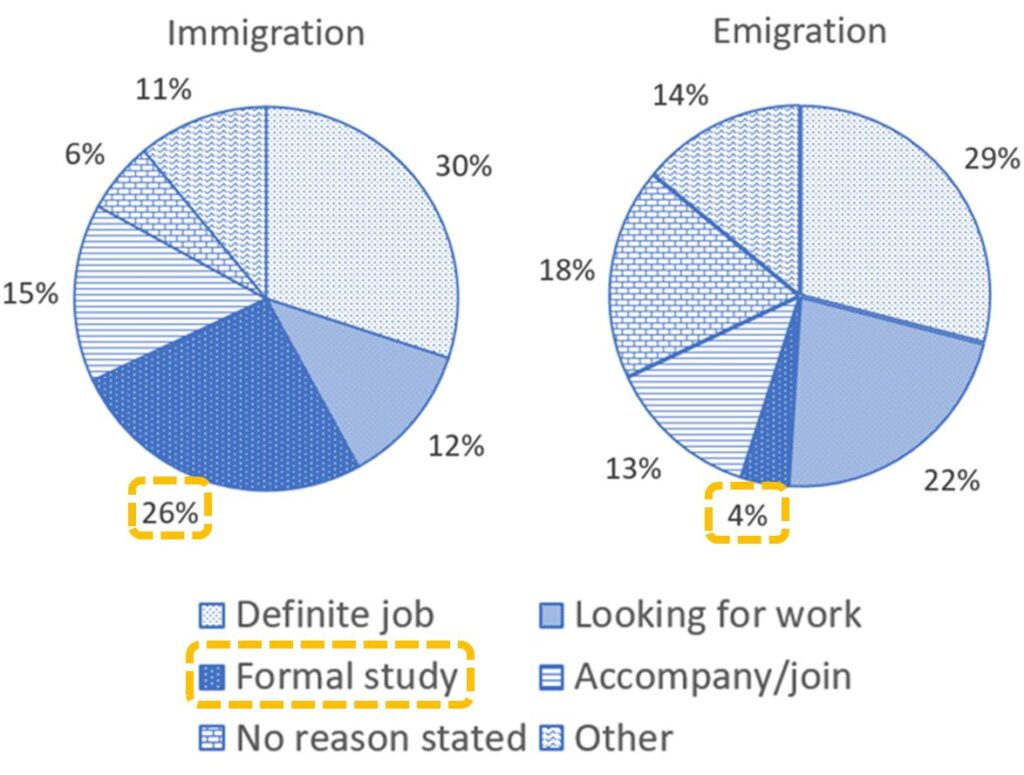
ボディ1 3文目
勉強(Formal study)のために移動した人はimmigrationが26%でemigration(4%)の7倍近くだった。
Formal study attracted 26% of immigrants to the UK, a proportion nearly seven times greater than the 4% of emigrants who left the UK for education.
正規の教育を受けるために英国に移住(Immigrate)した人の割合は26%で、教育を受けるために英国を離れた人の割合 (4%) の7倍に近い。
ポイント
ボディ1全体
Work-related factors, including specific job offers or the search for employment, accounted for 42% of immigration and 51% of emigration. Approximately 30% of both immigrants and emigrants moved for defined jobs, although a notable disparity existed regarding job-seeking, with 12% of immigrants compared to 22% of emigrants citing this as their reason. Formal study attracted 26% of immigrants to the UK, a proportion nearly seven times greater than the 4% of emigrants who left the UK for education.
特定の仕事のオファーや仕事探しを含む仕事関連の要因は、Immigrationの42%、Emigrationの51%を占めた。Immigration、Emigrationともに約30%が特定の仕事のために移動したが、仕事探しに関しては、Immigrationの12%が仕事探しを理由に挙げているのに対し、Emigrationの22%は仕事探しを理由に挙げており、顕著な差があった。正規の教育を受けるために英国に移住(Immigrate)した人の割合は26%で、教育を受けるために英国を離れた人の割合 (4%) の7倍に近い。
ボディ2
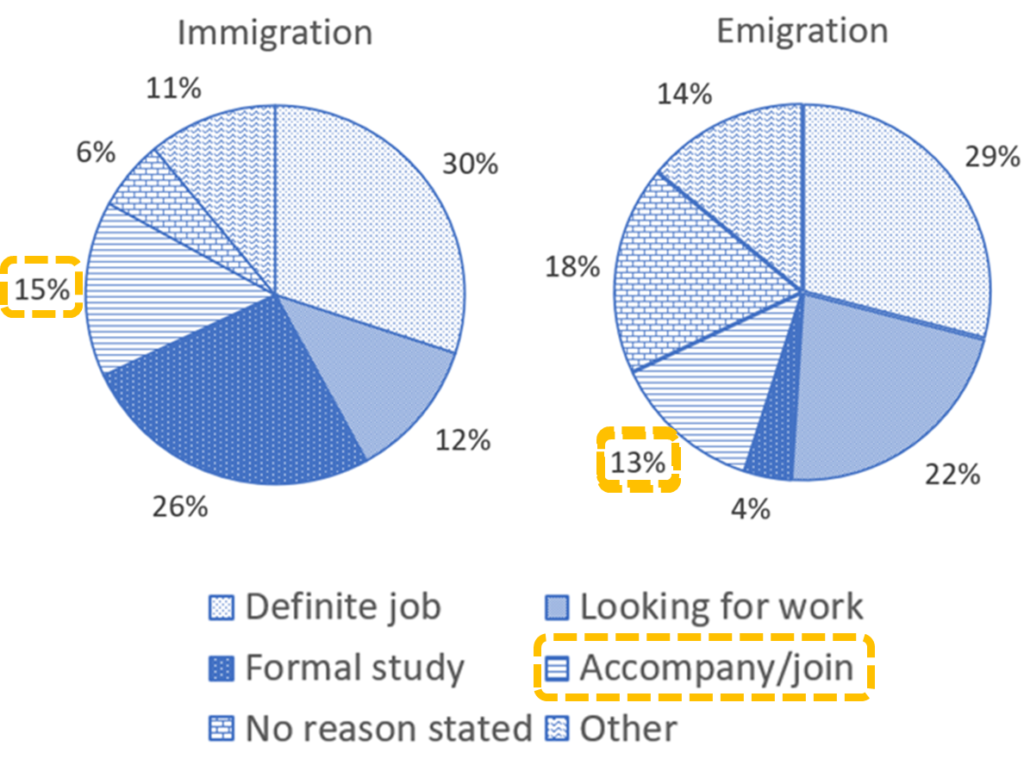
ボディ2 1文目
Accompany/join(結婚など)で移動した人はimmigrationで15%、emigrationで13%でほぼ同じ割合だった。
The proportion of individuals migrating to accompany others was similar, at 15% for immigrants and 13% for emigrants.
他の人に同行するために移住した人の割合も同様で、移民が15%、移民が13%だった。
ポイント
- at を使って数値の説明を追加しました。数値の表現の方法はこちら
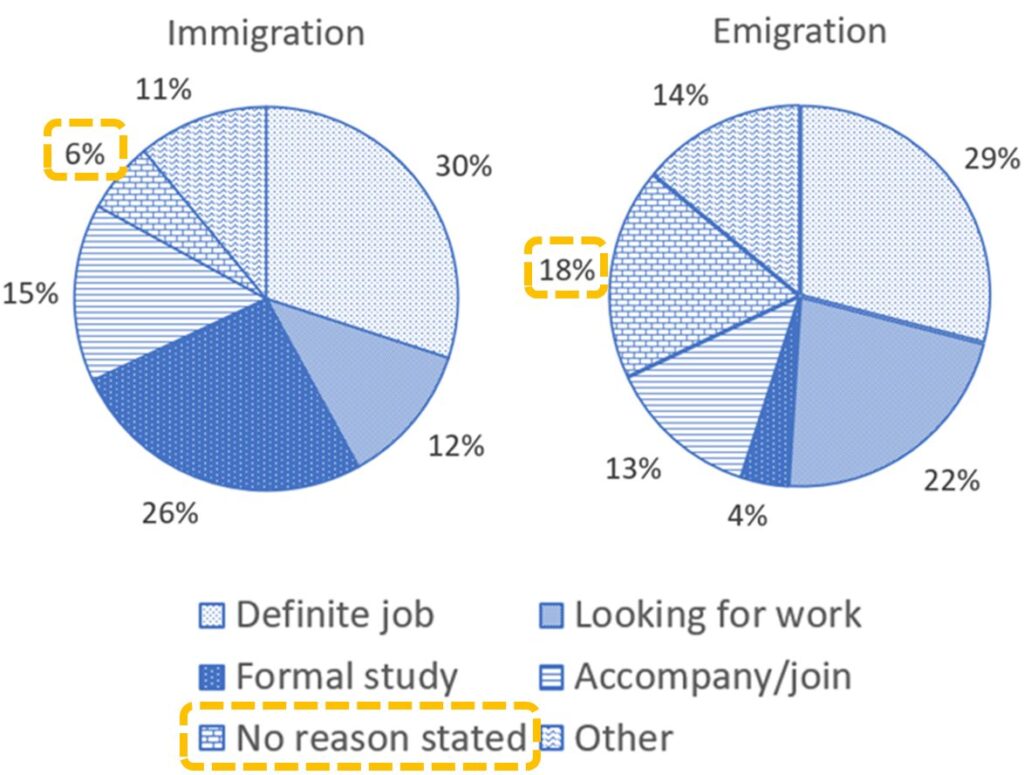
ボディ2 2文目
No reason statedの割合はimmigrationで6%に対してemigrationでは高く18%だった。
Additionally, 6% of immigrants moved to the UK for unspecified reasons, compared to a significantly higher 18% of emigrants leaving without a specific reason.
さらに、移民の6%が理由を特定せずに英国に移住したのに対し、特定の理由なしに英国を離れた人の割合は18%と大幅に高かった。
ポイント
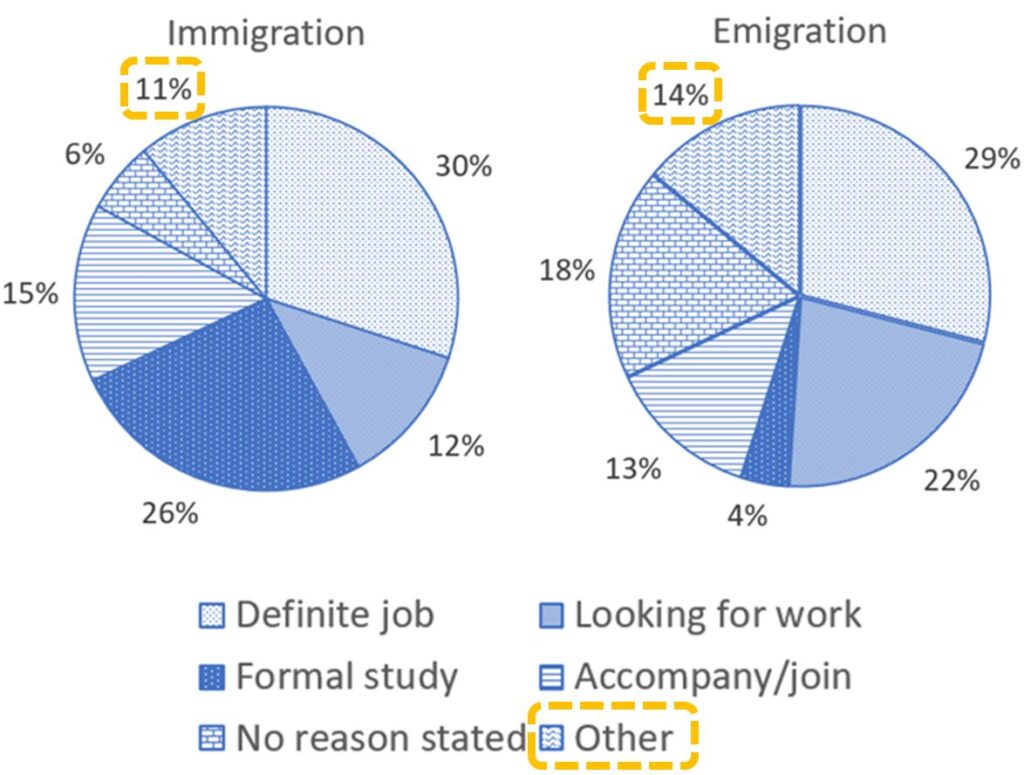
ボディ2 3文目
Otherの理由の割合はimmigration 11%とemigration 14%でともに小さかった。
Other motives constituted a relatively small share, with 11% of immigration and 14% of emigration attributed to miscellaneous factors.
その他の理由は比較的少なく、移民の11%、移民の14%がその他の要因によるものだった。
ポイント
- 付帯状況のwithを使って情報を追加しました。数値の説明の表現方法はこちら
- OtherをOther motivesとmiscellaneous factorsにパラフレイズしました。
ボディ2全体
The proportion of individuals migrating to accompany others was similar, at 15% for immigrants and 13% for emigrants. Additionally, 6% of immigrants moved to the UK for unspecified reasons, compared to a significantly higher 18% of emigrants leaving without a specific reason. Other motives constituted a relatively small share, with 11% of immigration and 14% of emigration attributed to miscellaneous factors.
他の人に同行するために移住した人の割合も同様で、移民が15%、移民が13%だった。さらに、移民の6%が理由を特定せずに英国に移住したのに対し、特定の理由なしに英国を離れた人の割合は18%と大幅に高かった。その他の理由は比較的少なく、移民の11%、移民の14%がその他の要因によるものだった。
スタティック円グラフ その2
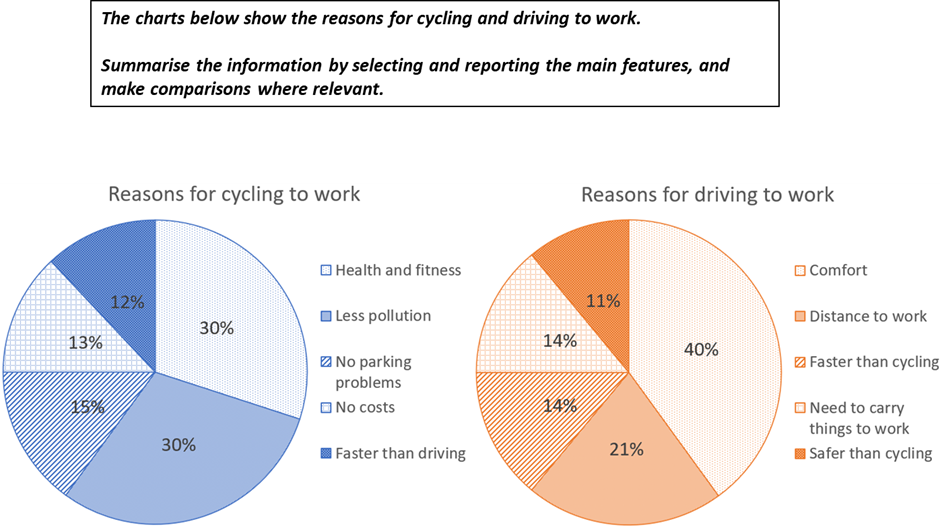
サンプル回答&ポイント解説
サンプル回答
The two pie charts depict the primary reasons individuals commute to work by bicycle or car, expressed as percentages. Overall, the most significant factor for those cycling to work was health and environmental considerations, whereas car commuters primarily valued the comfort of travel. A small minority cited speed and safety as their reasons for choosing bicycles or cars, respectively.
2つの円グラフは、自転車や車で通勤する主な理由をパーセンテージで表したものです。全体的に、自転車通勤者にとって最も重要な要因は健康と環境への配慮であり、車通勤者は主に移動の快適さを重視していた。自転車や車を選ぶ理由として、速さと安全性を挙げた人は少数派だった。
For cyclists, health and environmental concerns dominated, with each accounting for 30% of responses. Parking convenience and cost savings were notable factors, representing 15% and 13% of cyclists, respectively. Only 12% of respondents chose bicycles for their time-saving advantage over cars.
自転車通勤者は、健康と環境への配慮が回答の30%を占めた。駐車場の利便性とコスト削減は、それぞれ15%と13%を占めた。時間の節約を理由に自転車を選んだ人は12%にとどまった。
Car users, on the other hand, highlighted comfort as the principal reason, accounting for 40% of responses. Distance to the workplace was the second most cited reason at just over a quarter. Both faster journey times and the need to transport luggage were tied at 14%. Safety considerations constituted the smallest share of reasons for car use, at 11%.
一方、自動車利用者は快適性を理由に挙げており、40%を占めた。職場までの距離が2番目に多く、1/4強だった。移動時間の短縮と荷物の運搬の必要性はともに14%で同じ割合だった。安全性への配慮は、自動車利用の理由の11%で最も少なかった。
ポイント解説
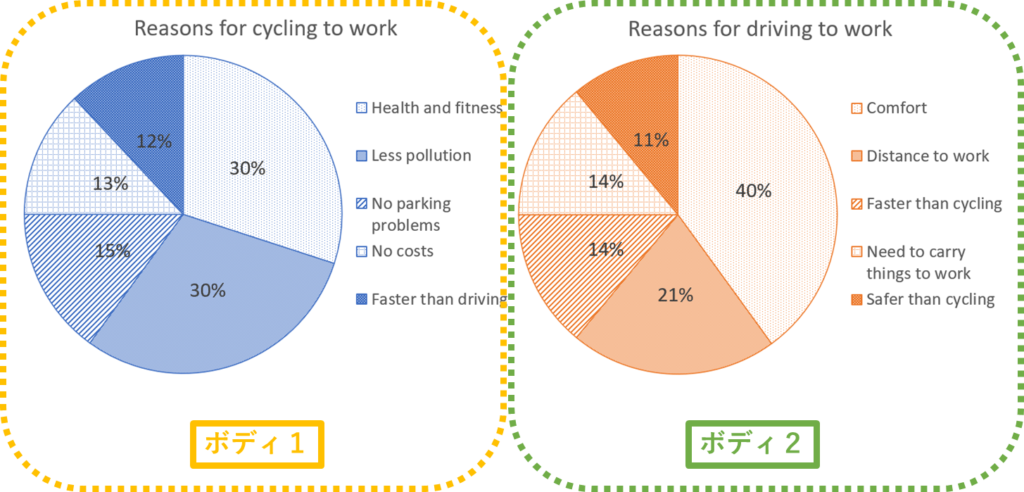
イントロダクション
1文目:問題文のパラフレイズ
- 問題文のパラフレイズについてはこちら
(問題文)The charts below show the reasons for cycling and driving to work.
⇓ ⇓ ⇓
(パラフレイズ)The two pie charts depict the primary reasons individuals commute to work by bicycle or car, expressed as percentages.
2つの円グラフは、自転車や車で通勤する主な理由をパーセンテージで表したものです。
2文目:Overall
- Overallについてはこちら
Overall 1文目
cyclingで通勤する人の理由は主にHealth and fitness (30%)とLess pollution(30%)(オレンジ)で、drivingで通勤する人の理由は主にComfort (40%)(緑)だった。
Overall, the most significant factor for those cycling to work was health and environmental considerations, whereas car commuters primarily valued the comfort of travel.
全体的に、自転車通勤者にとって最も重要な要因は健康と環境への配慮であり、車通勤者は主に移動の快適さを重視していた。
ポイント
- Health and fitnessとLess pollutionをまとめてhealth and environmental considerationsにパラフレイズしました。Comfortは具体的にcomfort of travelにしました。
- whereasを使ってcyclingとdrivingの1番の理由を対比しました。Overallの対比表現はこちら
Overall 2文目
cyclingでFaster than driving(車より早い)を選んだ人(12%)とdrivingでSafer than cycling(自転車より安全)を選んだ人(11%)は少数だった。
A small minority cited speed and safety as their reasons for choosing bicycles or cars, respectively.
自転車や車を選ぶ理由として、速さと安全性を挙げた人は少数派だった。
ポイント
- Overallでは具体的な数字は入れず少数(minority)や大多数(Majority)で表現
- それぞれ(respectively)を表す表現はこちら
イントロダクションパラグラフ全体
The two pie charts depict the primary reasons individuals commute to work by bicycle or car, expressed as percentages. Overall, the most significant factor for those cycling to work was health and environmental considerations, whereas car commuters primarily valued the comfort of travel. A small minority cited speed and safety as their reasons for choosing bicycles or cars, respectively.
2つの円グラフは、自転車や車で通勤する主な理由をパーセンテージで表したものです。全体的に、自転車通勤者にとって最も重要な要因は健康と環境への配慮であり、車通勤者は主に移動の快適さを重視していた。自転車や車を選ぶ理由として、速さと安全性を挙げた人は少数派だった。
ボディ1
ボディ1 1文目
cyclingの主な理由はHealth and fitnessとLess pollutionでそれぞれ30%だった。
For cyclists, health and environmental concerns dominated, with each accounting for 30% of responses.
自転車通勤者は、健康と環境への配慮が回答の30%を占めた。
ポイント
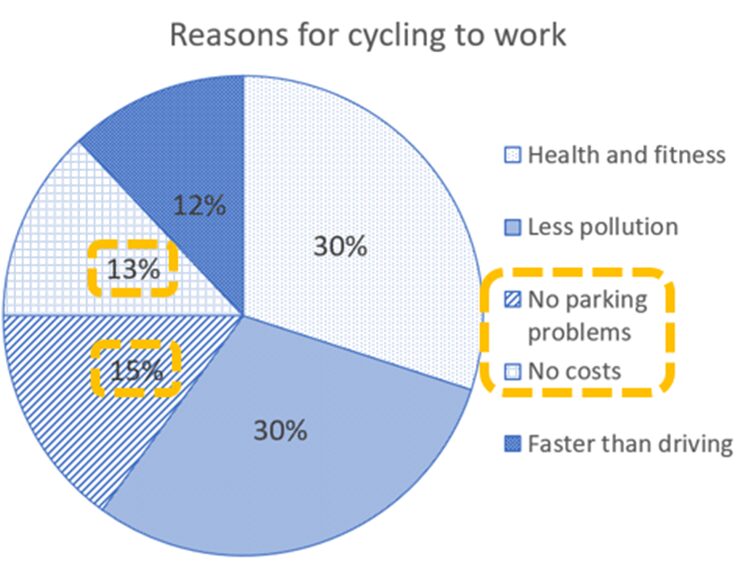
ボディ1 2文目
cyclingの人の中でNo parking problemとNo costsを選んだ人の割合はそれぞれ15%と13%だった。
Parking convenience and cost savings were notable factors, representing 15% and 13% of cyclists, respectively.
駐車場の利便性とコスト削減は、それぞれ15%と13%を占めた。
ポイント
ボディ1 3文目
12%だけがcyclingの方が車より早い(Faster than driving)と回答した。
Only 12% of respondents chose bicycles for their time-saving advantage over cars.
時間の節約を理由に自転車を選んだ人は12%にとどまった。
ポイント
- Faster than drivingをtime-saving advantageにパラフレイズしました。
ボディ1全体
For cyclists, health and environmental concerns dominated, with each accounting for 30% of responses. Parking convenience and cost savings were notable factors, representing 15% and 13% of cyclists, respectively. Only 12% of respondents chose bicycles for their time-saving advantage over cars.
自転車通勤者は、健康と環境への配慮が回答の30%を占めた。駐車場の利便性とコスト削減は、それぞれ15%と13%を占めた。時間の節約を理由に自転車を選んだ人は12%にとどまった。
ボディ2
ボディ2 1文目
drivingで通勤する人の40%はその理由をComfortと回答した。
Car users, on the other hand, highlighted comfort as the principal reason, accounting for 40% of responses.
一方、自動車利用者は快適性を理由に挙げており、40%を占めた。
ポイント
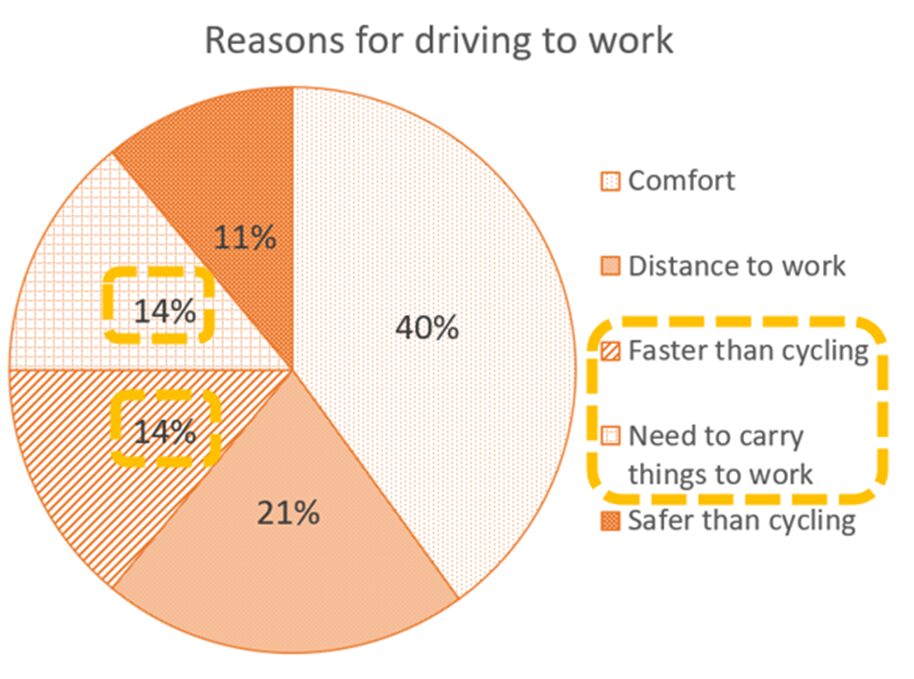
ボディ2 3文目
Faster than cyclingとNeed to carry things to workの割合はそれぞれ14%だった。
Both faster journey times and the need to transport luggage were tied at 14%.
移動時間の短縮と荷物の運搬の必要性はともに14%で同じ割合だった。
ポイント
- Faster than cyclingをfaster journey timesに、Need to carry things to workをneed to transport luggageに言い換えました。
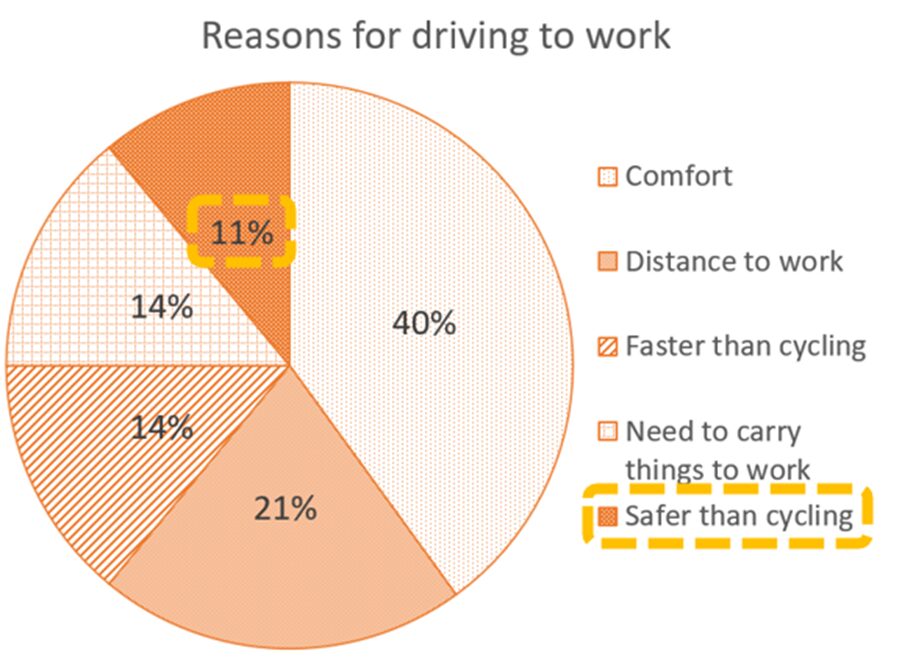
ボディ2全体
Car users, on the other hand, highlighted comfort as the principal reason, accounting for 40% of responses. Distance to the workplace was the second most cited reason at just over a quarter. Both faster journey times and the need to transport luggage were tied at 14%. Safety considerations constituted the smallest share of reasons for car use, at 11%.
一方、自動車利用者は快適性を理由に挙げており、40%を占めた。職場までの距離が2番目に多く、1/4強だった。移動時間の短縮と荷物の運搬の必要性はともに14%で同じ割合だった。安全性への配慮は、自動車利用の理由の11%で最も少なかった。
スタティック表 その1
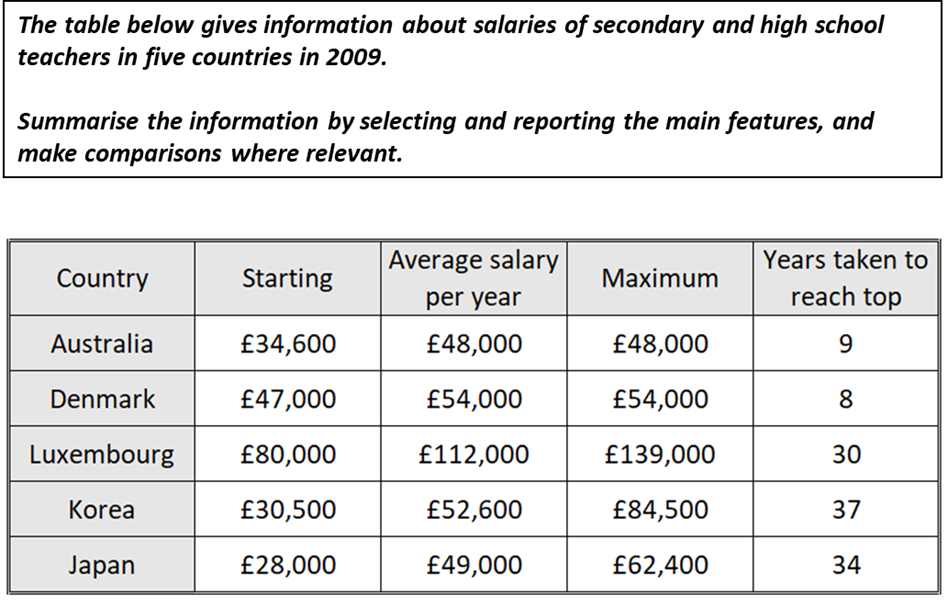
サンプル回答&ポイント解説
サンプル回答
The table presents the salaries of teachers employed in secondary and high schools across five countries in 2009. Overall, teachers in Luxembourg consistently earned the highest salaries, though, as in Korea and Japan, it took a considerable number of years to reach the maximum pay scale. By contrast, achieving the top salary required significantly less time in Australia and Denmark.
この表は、2009年に5カ国の中学と高校で雇用された教師の給与を示している。全体的に見て、ルクセンブルクの教師は常に最も高い給与を得ているが、韓国や日本と同様に、最高給与水準に達するまでにかなりの年数を要した。対照的に、オーストラリアとデンマークでは、最高給与水準に達するまでの期間が大幅に短かった。
In Luxembourg, teachers started their careers with a salary of £80,000, substantially higher than Denmark’s £47,000, which ranked second. The starting salaries in the remaining three countries were markedly lower, averaging around £30,000. The pattern was similar for average salaries, with Luxembourg again leading at £112,000, more than double the figures for the other countries, which ranged from £48,000 to £54,000.
ルクセンブルクの教師の初任給は80,000ポンドで、2位のデンマークの47,000ポンドを大幅に上回った。残りの3ヵ国の初任給は著しく低く、平均約30,000ポンドだった。平均給与でも似たようなパターンが見られ、ルクセンブルクが112,000ポンドでトップに立った。他の国の初任給は48,000ポンドから54,000ポンドの範囲だった。
Luxembourg also had the highest maximum salary at £139,000, followed by Korea at £84,500 and Japan at £62,400. However, achieving these figures required lengthy service, with teachers needing 37 years in Korea, 34 years in Japan, and 30 years in Luxembourg. In contrast, while the maximum salaries in Denmark (£54,000) and Australia (£48,000) were comparatively lower, teachers in these countries reached the top of the pay scale within just 8 and 9 years, respectively.
また、ルクセンブルクの最高給与は139,000ポンドで、韓国が84,500ポンド、日本が62,400ポンドと続いた。しかし、これらの数字を達成するには、韓国では37年、日本では34年、ルクセンブルクでは30年の勤務が必要である。対照的に、デンマーク (54,000ポンド) とオーストラリア (48,000ポンド) の最高給与は比較的低いが、これらの国の教師はそれぞれわずか8年と9年で給与水準のトップに達した。
ポイント解説
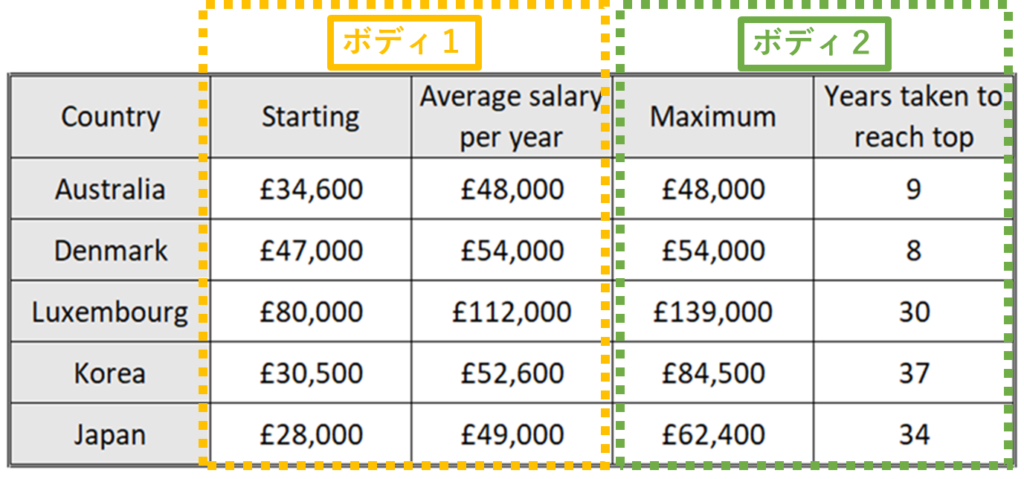
イントロダクション
1文目:問題文のパラフレイズ
- 問題文のパラフレイズについてはこちら
(問題文)The charts below show the reasons for cycling and driving to work.
⇓ ⇓ ⇓
(パラフレイズ)The table presents the salaries of teachers employed in secondary and high schools across five countries in 2009.
この表は、2009年に5カ国の中学と高校で雇用された教師の給与を示している。
2文目:Overall
- Overallについてはこちら
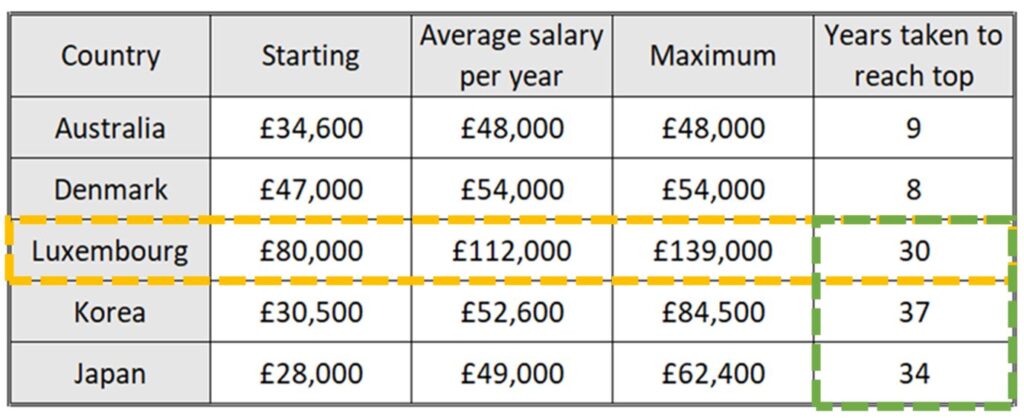
Overall 1文目
LuxembourgのStartingとAverage salary per yearが他の国より高い(オレンジ)。しかしKoreaとJapanと同じようにLuxembourgではMaximumの給料を得るのに長い年数がかかる(緑)。
Overall, teachers in Luxembourg consistently earned the highest salaries, though, as in Korea and Japan, it took a considerable number of years to reach the maximum pay scale.
全体的に見て、ルクセンブルクの教師は常に最も高い給与を得ているが、韓国や日本と同様に、最高給与水準に達するまでにかなりの年数を要した。
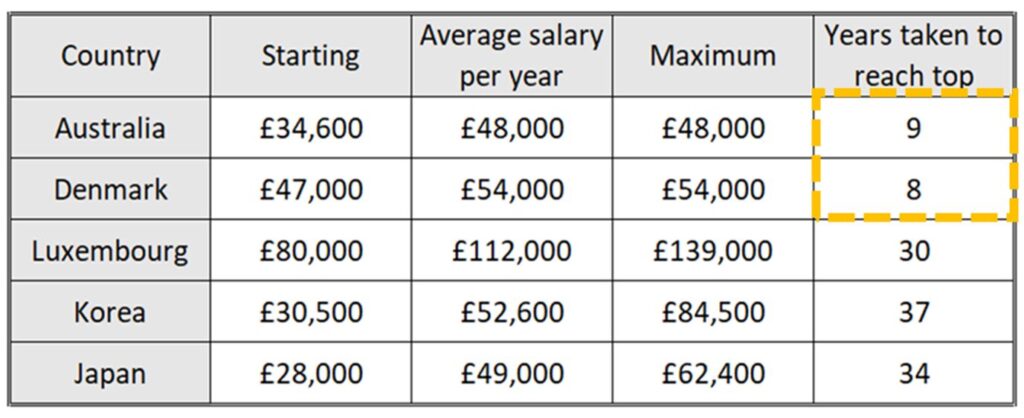
Overall 2文目
Maximumの給与を得るのにかかる年数はAustraliaとDenmarkでは他の国と比べて少ない。
By contrast, achieving the top salary required significantly less time in Australia and Denmark.
対照的に、オーストラリアとデンマークでは、最高給与水準に達するまでの期間が大幅に短かった。
イントロダクションパラグラフ全体
The table presents the salaries of teachers employed in secondary and high schools across five countries in 2009. Overall, teachers in Luxembourg consistently earned the highest salaries, though, as in Korea and Japan, it took a considerable number of years to reach the maximum pay scale. By contrast, achieving the top salary required significantly less time in Australia and Denmark.
この表は、2009年に5カ国の中学と高校で雇用された教師の給与を示している。全体的に見て、ルクセンブルクの教師は常に最も高い給与を得ているが、韓国や日本と同様に、最高給与水準に達するまでにかなりの年数を要した。対照的に、オーストラリアとデンマークでは、最高給与水準に達するまでの期間が大幅に短かった。
ボディ1
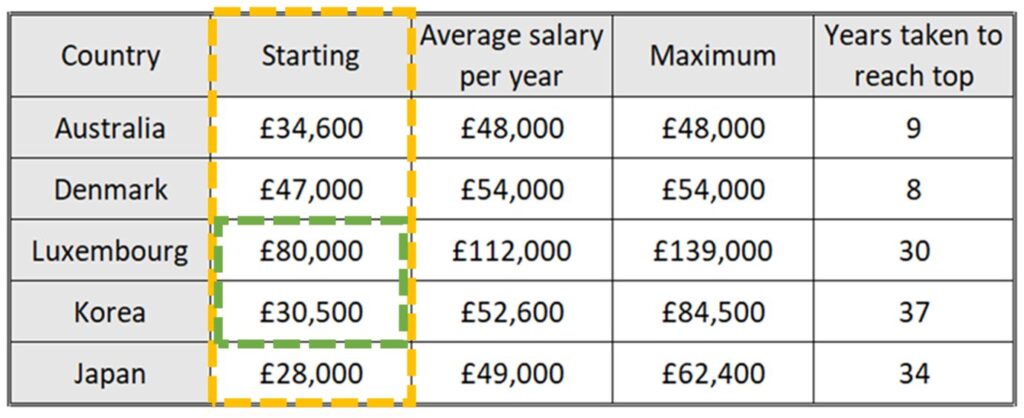
ボディ1 1文目&2文目
Luxembourgでは先生は£80,000で給与はスタートし、2番目のDenmarkの£47,000より相当高い(緑)。その他の3ヵ国のStarting salaryはLuxembourgとDenmarkより相当低く平均はだいたい£30,000くらいだった。
In Luxembourg, teachers started their careers with a salary of £80,000, substantially higher than Denmark’s £47,000, which ranked second. The starting salaries in the remaining three countries were markedly lower, averaging around £30,000.
ルクセンブルクの教師の初任給は80,000ポンドで、2位のデンマークの47,000ポンドを大幅に上回った。残りの3ヵ国の初任給は著しく低く、平均約30,000ポンドだった。
ポイント
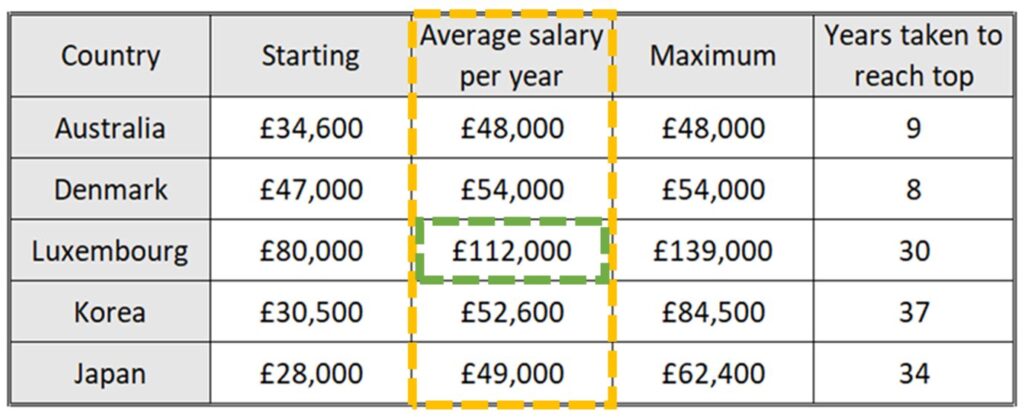
ボディ1 3文目
Average salary per yearもStarting salaryと同じようにLuxembourgが£112,000でもっと高く、他の国( £48,000~£54,000)の2倍以上だった。
The pattern was similar for average salaries, with Luxembourg again leading at £112,000, more than double the figures for the other countries, which ranged from £48,000 to £54,000.
平均給与でも似たようなパターンが見られ、ルクセンブルクが112,000ポンドでトップに立った。他の国の初任給は48,000ポンドから54,000ポンドの範囲だった。
ポイント
ボディ1全体
In Luxembourg, teachers started their careers with a salary of £80,000, substantially higher than Denmark’s £47,000, which ranked second. The starting salaries in the remaining three countries were markedly lower, averaging around £30,000. The pattern was similar for average salaries, with Luxembourg again leading at £112,000, more than double the figures for the other countries, which ranged from £48,000 to £54,000.
ルクセンブルクの教師の初任給は80,000ポンドで、2位のデンマークの47,000ポンドを大幅に上回った。残りの3ヵ国の初任給は著しく低く、平均約30,000ポンドだった。平均給与でも似たようなパターンが見られ、ルクセンブルクが112,000ポンドでトップに立った。他の国の初任給は48,000ポンドから54,000ポンドの範囲だった。
ボディ2
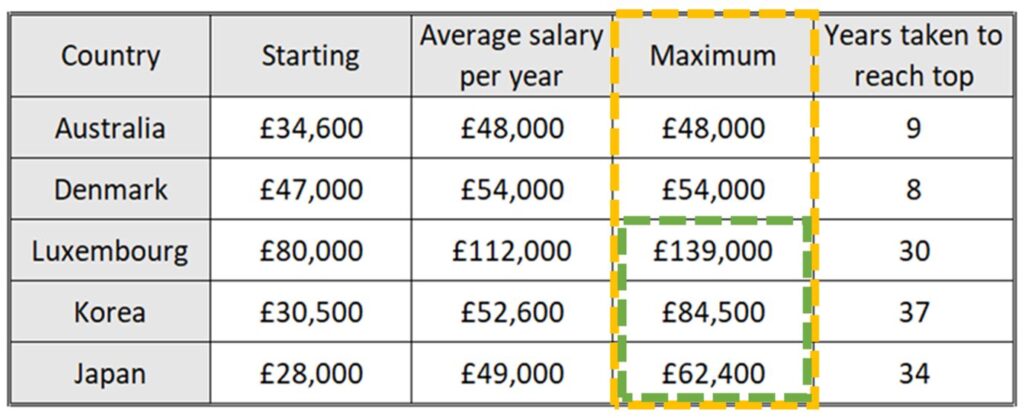
ボディ2 1文目
LuxembourgのMaximum salaryは£139,000で最も高く、次いでKoreaが£84,500、Japanが£62,400だった。
Luxembourg also had the highest maximum salary at £139,000, followed by Korea at £84,500 and Japan at £62,400.
また、ルクセンブルクの最高給与は139,000ポンドで、韓国が84,500ポンド、日本が62,400ポンドと続いた。
ポイント
- followed byを使って1番、2番、3番を表示しました。順番の表し方はこちら
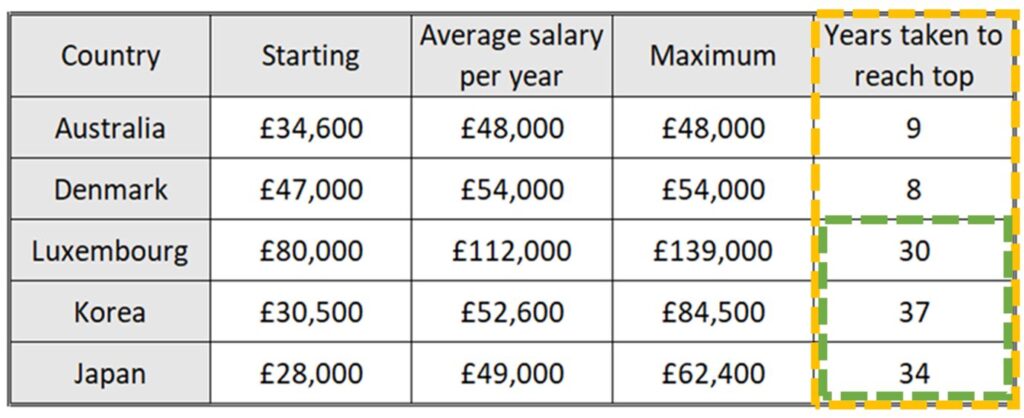
ボディ2 2文目
Maximum salaryを得るのには長い年数かかり、Koreaで37年、Japanで34年、Luxembourgで30年だった。
However, achieving these figures required lengthy service, with teachers needing 37 years in Korea, 34 years in Japan, and 30 years in Luxembourg.
しかし、これらの数字を達成するには、韓国では37年、日本では34年、ルクセンブルクでは30年の勤務が必要である。
ポイント
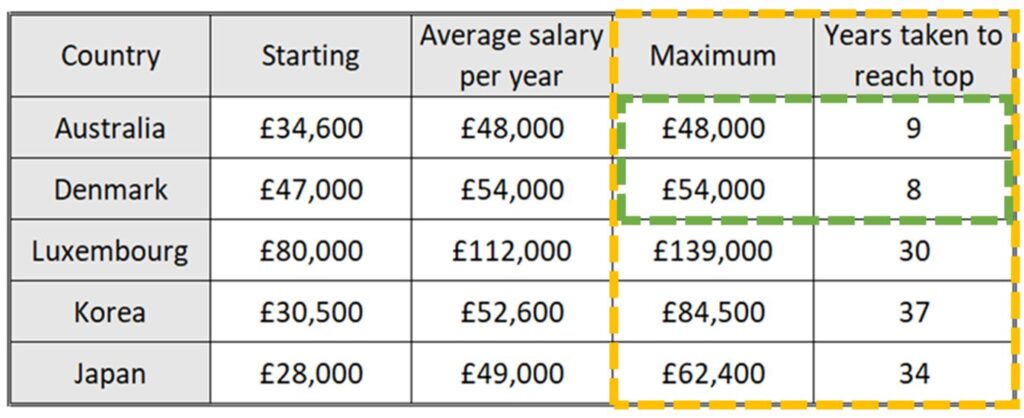
ボディ2 3文目
DenmarkとAustraliaではMaximum salaryは£54,000と£48,000で低いが、それぞれ8年、9年の年数で達することができる。
In contrast, while the maximum salaries in Denmark (£54,000) and Australia (£48,000) were comparatively lower, teachers in these countries reached the top of the pay scale within just 8 and 9 years, respectively.
対照的に、デンマーク (54,000ポンド) とオーストラリア (48,000ポンド) の最高給与は比較的低いが、これらの国の教師はそれぞれわずか8年と9年で給与水準のトップに達した。
ポイント
- whileを使った対比表現についてはこちら
- salaryをpay scaleにパラフレイズしました。
- それぞれ(respectively)を表す表現はこちら
ボディ2全体
Luxembourg also had the highest maximum salary at £139,000, followed by Korea at £84,500 and Japan at £62,400. However, achieving these figures required lengthy service, with teachers needing 37 years in Korea, 34 years in Japan, and 30 years in Luxembourg. In contrast, while the maximum salaries in Denmark (£54,000) and Australia (£48,000) were comparatively lower, teachers in these countries reached the top of the pay scale within just 8 and 9 years, respectively.
また、ルクセンブルクの最高給与は139,000ポンドで、韓国が84,500ポンド、日本が62,400ポンドと続いた。しかし、これらの数字を達成するには、韓国では37年、日本では34年、ルクセンブルクでは30年の勤務が必要である。対照的に、デンマーク (54,000ポンド) とオーストラリア (48,000ポンド) の最高給与は比較的低いが、これらの国の教師はそれぞれわずか8年と9年で給与水準のトップに達した。
スタティック表 その2
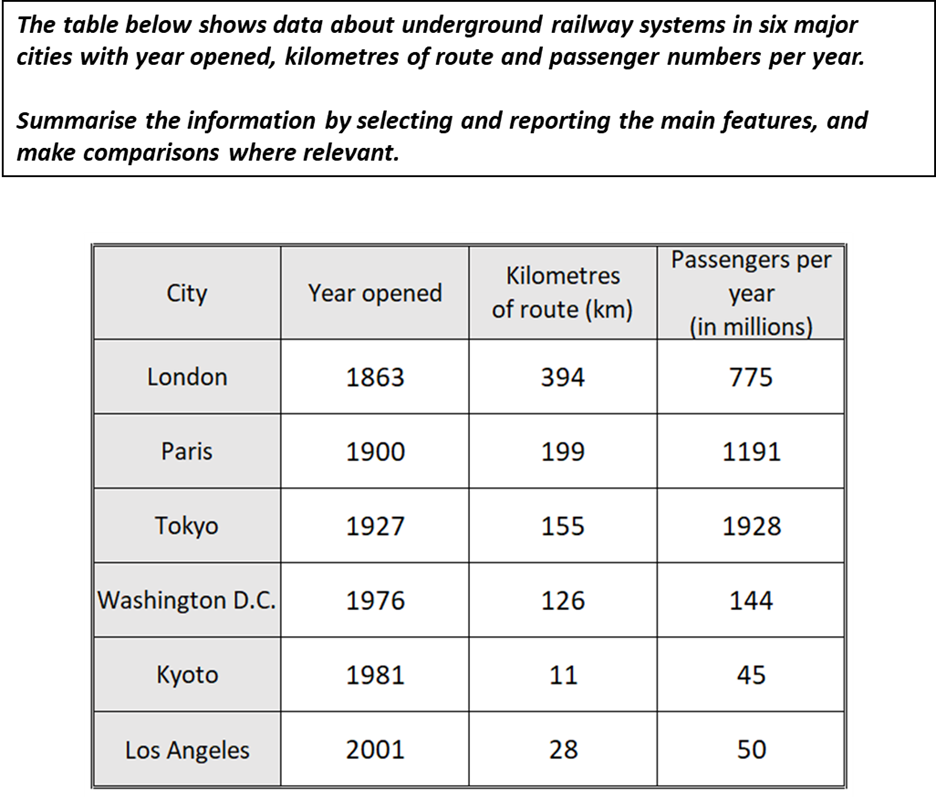
サンプル回答&ポイント解説
サンプル回答
The table provides information on subway systems in six cities, detailing their year of establishment, route length, and annual passenger numbers. Overall, older underground networks tend to feature longer routes and accommodate more passengers. London boasts the oldest and longest system, while Tokyo leads in passenger numbers. Conversely, Kyoto has the shortest network, the most recent establishment date, and the fewest users.
表は、6都市の地下鉄について、設立年、路線長、年間乗客数の詳細を示している。全体的に、古い地下鉄網は路線が長く、より多くの人が利用する傾向がある。ロンドンは最も古く、最長の地下鉄網を誇り、東京は乗客数でトップである。逆に、京都は最も路線が短く、設立日が新しく、利用者が最も少ない。
London inaugurated its subway in 1863, with an extensive route length of 394 km, almost twice that of Paris, which opened its system in 1900 and spans 199 km. Tokyo followed in 1927, with a total route length of 155 km. Regarding passenger numbers, Tokyo dominates with 1,928 million riders annually, far surpassing Paris with 1,191 million and London with 775 million.
ロンドンは1863年に地下鉄を開業し、路線長は394 kmと、1900年に開業したパリの199 kmのほぼ倍である。東京は1927年に開業し、路線長は155 kmである。乗客数では、東京が年間1928million人で、パリの1191million人、ロンドンの775million人を大きく上回っている。
More recently, Washington D.C., Kyoto, and Los Angeles introduced their subway systems in 1976, 1981, and 2001, respectively. Washington D.C. features the largest network among these cities, with a route length of 126 km and an annual ridership of 144 million. Kyoto’s subway, in contrast, is the smallest at just 11 km and serves 45 million passengers annually. Similarly, Los Angeles operates a 28 km network with 50 million annual users.
最近では、ワシントンDC、京都、ロサンゼルスがそれぞれ1976年、1981年、2001年に地下鉄を導入した。ワシントンDCは、これらの都市の中で最大のネットワークを特徴としており、路線長は126 km、年間利用者数は144million人である。対照的に、京都の地下鉄はわずか11 kmで最小であり、年間45million人の乗客が利用している。同様に、ロサンゼルスは28 kmのネットワークを運営しており、年間利用者数は50million人である。
ポイント解説
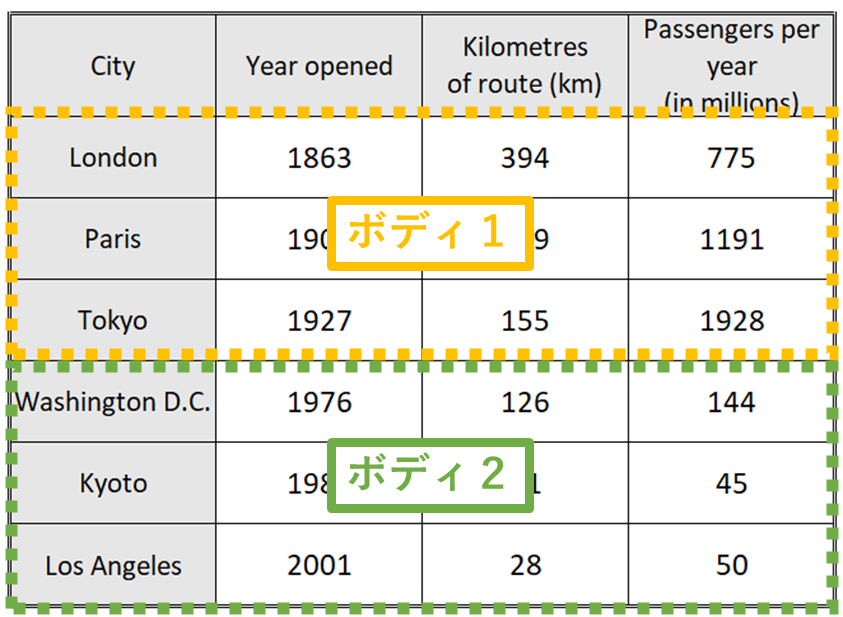
イントロダクション
1文目:問題文のパラフレイズ
- 問題文のパラフレイズについてはこちら
(問題文)The table below shows data about underground railway systems in six major cities with year opened, kilometres of route and passenger numbers per year.
⇓ ⇓ ⇓
(パラフレイズ)The table provides information on subway systems in six cities, detailing their year of establishment, route length, and annual passenger numbers.
表は、6都市の地下鉄について、設立年、路線長、年間乗客数の詳細を示している。
2文目:Overall
- Overallについてはこちら
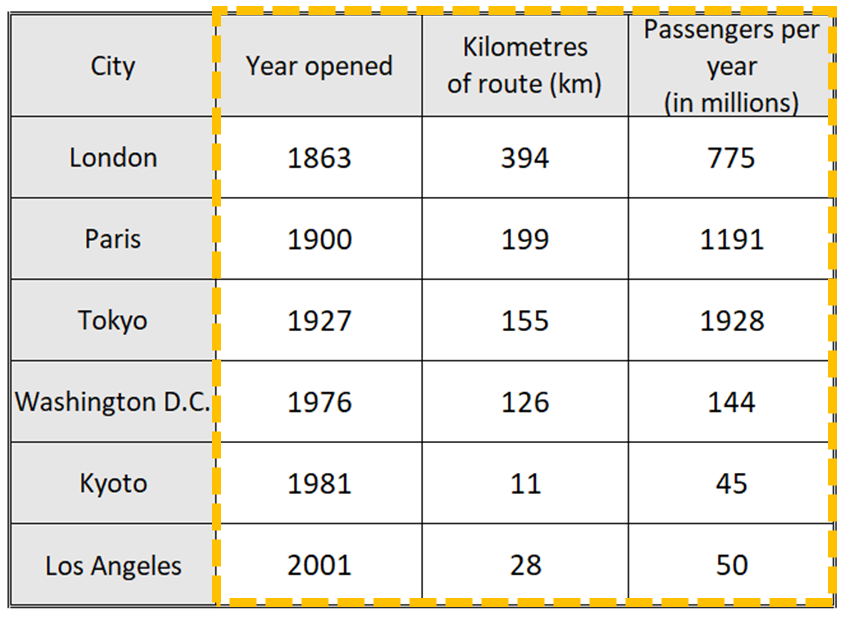
Overall 1文目
全体の傾向として古い地下鉄ほど距離が長く多くの年間利用者がいる。
Overall, older underground networks tend to feature longer routes and accommodate more passengers.
全体的に、古い地下鉄網は路線が長く、より多くの人が利用する傾向がある。
ポイント
- 古ければ古いほど利用者が多い訳ではない(Londonの方が古いけどTokyoの方が利用者が多い)ですが、tend toを使って全体の傾向を書きました。
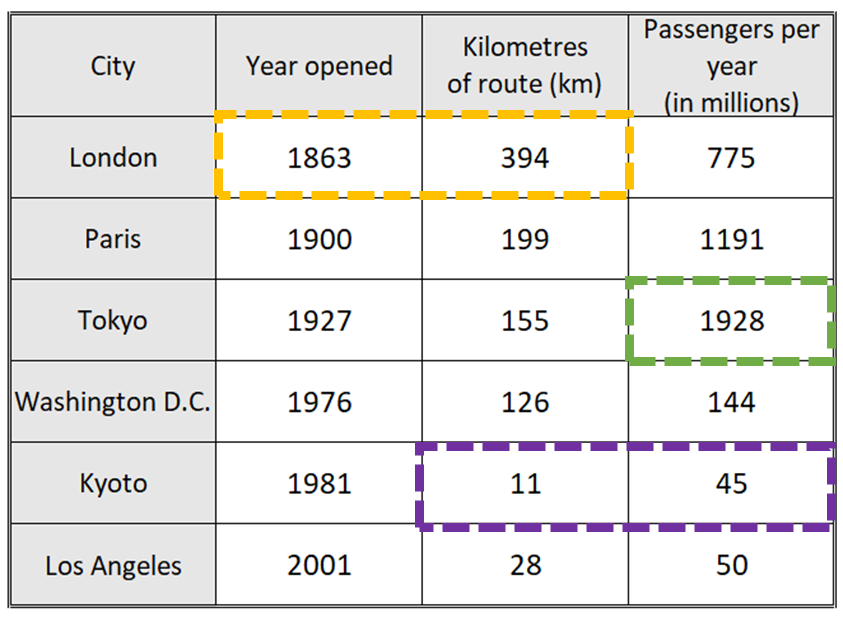
Overall 2文目
Londonは一番古く一番距離も長い(オレンジ)。Tokyoは利用者が一番多い(緑)。Kyotoは距離が一番短く利用者も一番少ない(紫)。
London boasts the oldest and longest system, while Tokyo leads in passenger numbers. Conversely, Kyoto has the shortest network, the most recent establishment date, and the fewest users.
ロンドンは最も古く、最長の地下鉄網を誇り、東京は乗客数でトップである。逆に、京都は最も路線が短く、設立日が新しく、利用者が最も少ない。
ポイント
- whileやconverselyの対比表現を使いました。Overallでの対比表現はこちら
- 利用者(数)をpassenger numbersやusersにパラフレイズしました。
イントロダクションパラグラフ全体
The table provides information on subway systems in six cities, detailing their year of establishment, route length, and annual passenger numbers. Overall, older underground networks tend to feature longer routes and accommodate more passengers. London boasts the oldest and longest system, while Tokyo leads in passenger numbers. Conversely, Kyoto has the shortest network, the most recent establishment date, and the fewest users.
表は、6都市の地下鉄について、設立年、路線長、年間乗客数の詳細を示している。全体的に、古い地下鉄網は路線が長く、より多くの人が利用する傾向がある。ロンドンは最も古く、最長の地下鉄網を誇り、東京は乗客数でトップである。逆に、京都は最も路線が短く、設立日が新しく、利用者が最も少ない。
ボディ1
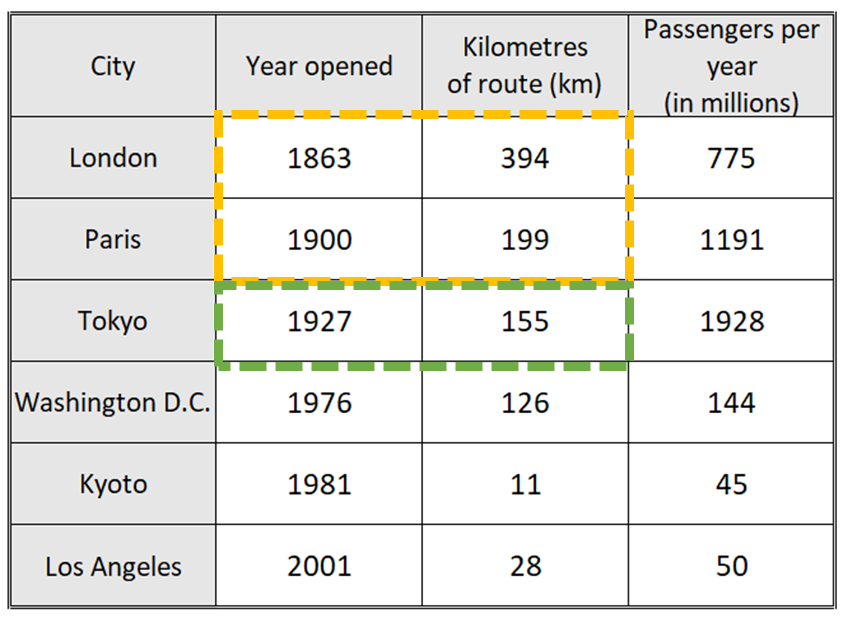
ボディ1 1文目&2文目
Londonの地下鉄は1863年に開業して、394㎞の長さがあり、それは1900年に開業して199㎞のParisの2倍の長さがある。Tokyoはその2つの都市に続いて1927年に開業して長さは155kmある。
London inaugurated its subway in 1863, with an extensive route length of 394 km, almost twice that of Paris, which opened its system in 1900 and spans 199 km. Tokyo followed in 1927, with a total route length of 155 km.
ロンドンは1863年に地下鉄を開業し、路線長は394 kmと、1900年に開業したパリの199 kmのほぼ倍である。東京は1927年に開業し、路線長は155 kmである。
ポイント
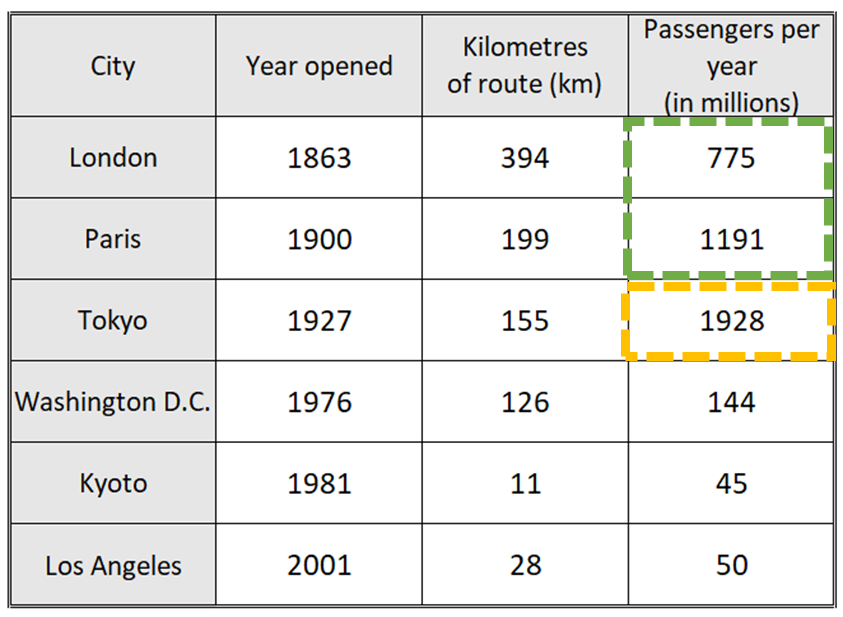
ボディ1 3文目
Tokyoは年間利用者が1,928 million(オレンジ)で、1,191 millionのParisと775 millionのLondon(緑)をはるかに上回っている。
Regarding passenger numbers, Tokyo dominates with 1,928 million riders annually, far surpassing Paris with 1,191 million and London with 775 million.
乗客数では、東京が年間1928million人で、パリの1191million人、ロンドンの775million人を大きく上回っている。
ポイント
- 利用者はイントロダクションパラグラフでpassengersやusersを使ったのでここではridersを使いました。
- 年間も表のper yearをannuallyにパラフレイズしました。
- 分詞構文(surpassing)を使って他の都市の情報を付け加えました。分詞構文ついてはこちら
ボディ1全体
London inaugurated its subway in 1863, with an extensive route length of 394 km, almost twice that of Paris, which opened its system in 1900 and spans 199 km. Tokyo followed in 1927, with a total route length of 155 km. Regarding passenger numbers, Tokyo dominates with 1,928 million riders annually, far surpassing Paris with 1,191 million and London with 775 million.
ロンドンは1863年に地下鉄を開業し、路線長は394 kmと、1900年に開業したパリの199 kmのほぼ倍である。東京は1927年に開業し、路線長は155 kmである。乗客数では、東京が年間1928million人で、パリの1191million人、ロンドンの775million人を大きく上回っている。
ボディ2
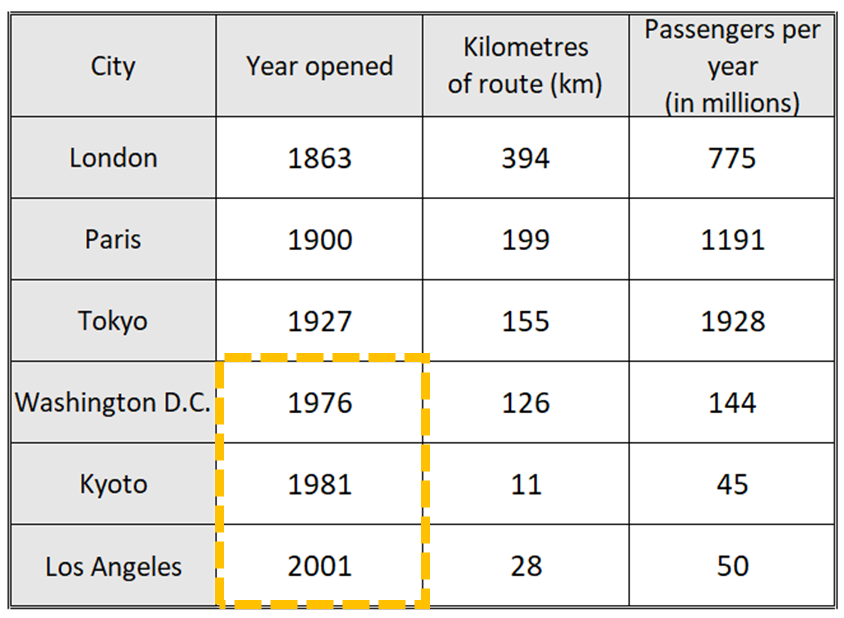
ボディ2 1文目
比較的新しいWashington D.C., Kyoto, Los Angelesの地下鉄はそれぞれ1976年, 1981年, 2001年にできた。
More recently, Washington D.C., Kyoto, and Los Angeles introduced their subway systems in 1976, 1981, and 2001, respectively.
最近では、ワシントンDC、京都、ロサンゼルスがそれぞれ1976年、1981年、2001年に地下鉄を導入した。
ポイント
- それぞれ(respectively)を表す表現はこちら
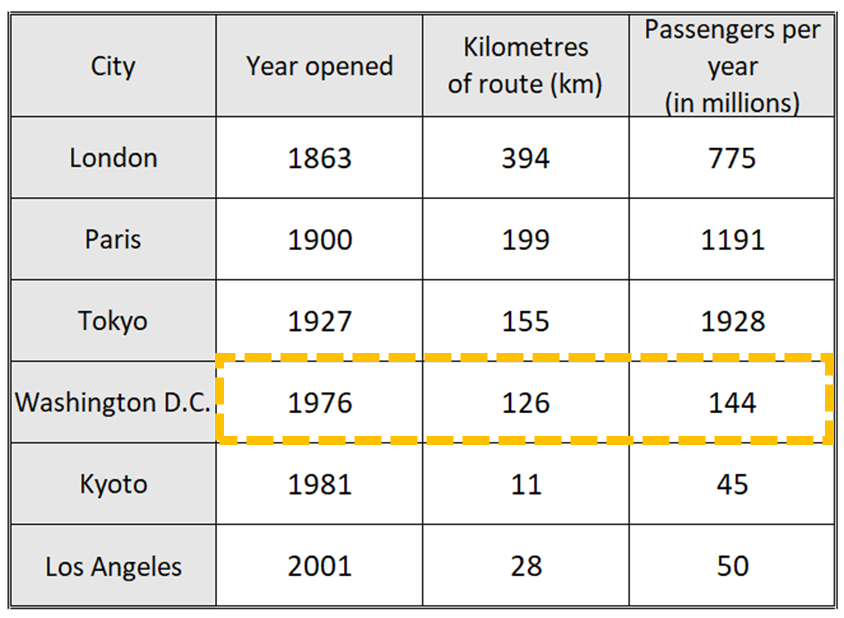
ボディ2 2文目
Washington D.CはWashington D.C., Kyoto, Los Angelesの中では一番長く126 kmで年間利用者144 millionだった。
Washington D.C. features the largest network among these cities, with a route length of 126 km and an annual ridership of 144 million.
ワシントンDCは、これらの都市の中で最大のネットワークを特徴としており、路線長は126 km、年間利用者数は144million人である。
ポイント
- largest—amongで3都市の比較をしました。
- 付帯状況のwithを使って数値の説明を追加しました。付帯状況のwithについてはこちら
- 年間利用者を前の文でpassengers, users, ridersを使って書いたのでここではannual ridershipにパラフレイズしました。
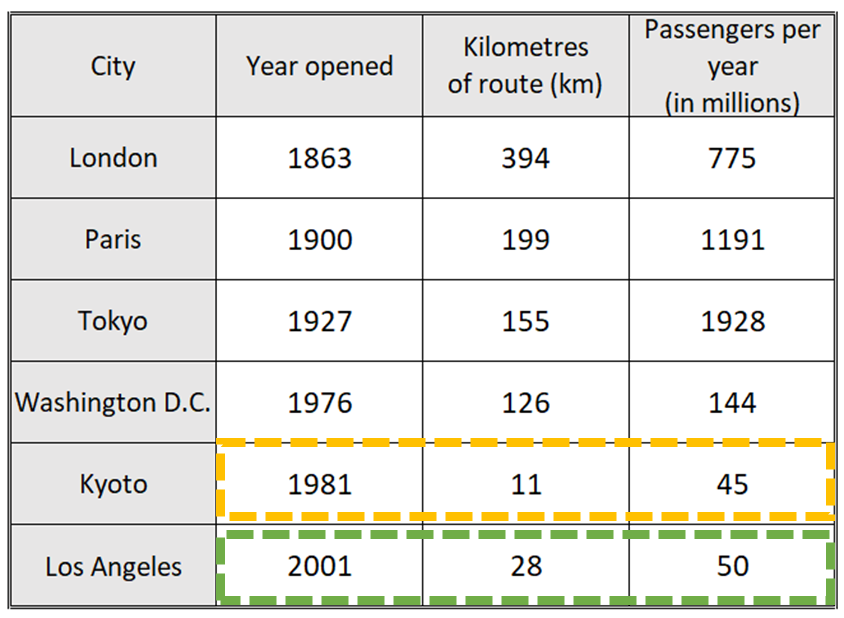
ボディ2 3文目&4文目
Washington D.C., Kyoto, Los Angelesの中でKyotoの地鉄は一番短く11㎞で年間利用者は 45 million(オレンジ)だった。Los Angelesは28㎞で年間利用者は 50 million(緑)だった。
Kyoto‘s subway, in contrast, is the smallest at just 11 km and serves 45 million passengers annually. Similarly, Los Angeles operates a 28 km network with 50 million annual users.
対照的に、京都の地下鉄はわずか11 kmで最小であり、年間45million人の乗客が利用している。同様に、ロサンゼルスは28 kmのネットワークを運営しており、年間利用者数は50million人である。
ポイント
- Kyoto‘s—is, serves, operatesなど色々な書き方に換えてみました。
- 比較表現(in contrast)を入れてWashington D.Cにしました。比較表現についてはこちら
- 2文目でWashington D.C.をlargestで書いたのでLos Angelesはsmallestと書きました。
ボディ2全体
More recently, Washington D.C., Kyoto, and Los Angeles introduced their subway systems in 1976, 1981, and 2001, respectively. Washington D.C. features the largest network among these cities, with a route length of 126 km and an annual ridership of 144 million. Kyoto’s subway, in contrast, is the smallest at just 11 km and serves 45 million passengers annually. Similarly, Los Angeles operates a 28 km network with 50 million annual users.
最近では、ワシントンDC、京都、ロサンゼルスがそれぞれ1976年、1981年、2001年に地下鉄を導入した。ワシントンDCは、これらの都市の中で最大のネットワークを特徴としており、路線長は126 km、年間利用者数は144million人である。対照的に、京都の地下鉄はわずか11 kmで最小であり、年間45million人の乗客が利用している。同様に、ロサンゼルスは28 kmのネットワークを運営しており、年間利用者数は50million人である。
地図 その1
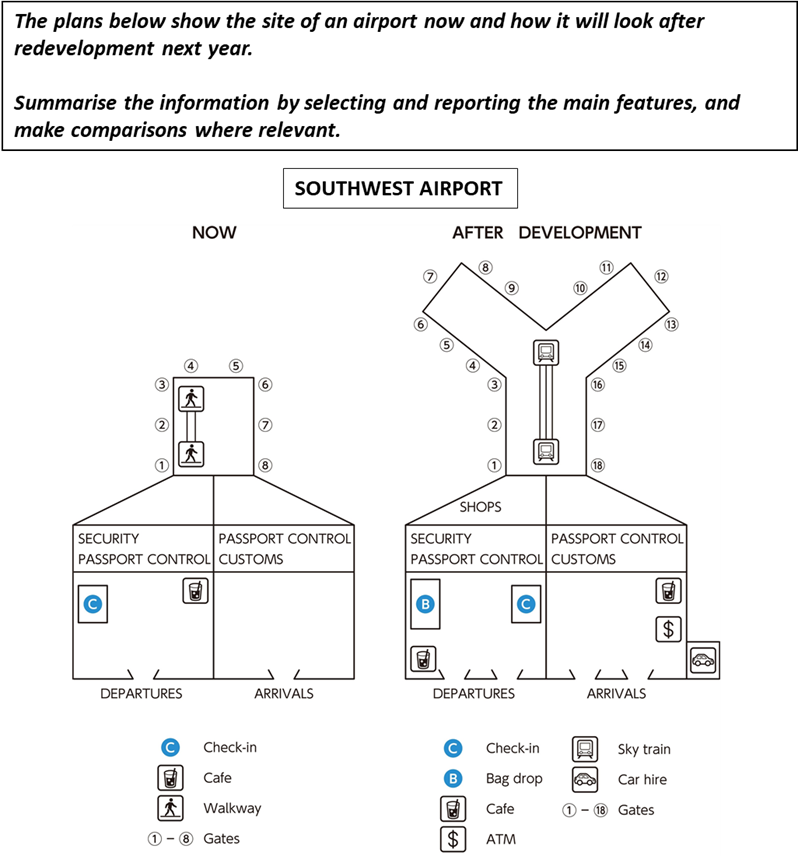
サンプル回答&ポイント解説
サンプル回答
The map outlines proposed renovation plans for Southwest Airport, scheduled to be implemented next year. Overall, the redevelopment aims to increase the number of boarding gates, introduce additional amenities, and relocate some existing facilities for improved efficiency and passenger experience.
この地図は、来年実施予定のサウスウエスト空港の改修計画の概要を示している。全体として、再開発は搭乗ゲートの数を増やし、追加のアメニティを導入し、効率と乗客体験を向上させるために既存の施設の一部を移転することを目的としている。
In the boarding area, the current rectangular layout with eight gates will be expanded into a Y-shaped design featuring 18 gates. The existing walkway will be replaced with a modern sky train to provide quicker access to the gates. Furthermore, new retail shops are added to open beyond the security and passport control zone. However, the departure and arrival entrances will remain in their current locations.
搭乗エリアでは、現在の8つのゲートを持つ長方形のレイアウトを拡大し、18のゲートを持つY字型のデザインにする。既存の通路は、より迅速にゲートにアクセスできるように、近代的なスカイトレインに置き換えられる。さらに、セキュリティとパスポートコントロールゾーンの後に新しい小売店が追加される。出発と到着の入り口は現在の場所で変わらない。
Before security and after customs, several changes are planned. In the departure zone, an additional entrance will be introduced, and the café will be relocated to a diagonally opposite position. A new bag-drop facility will replace the existing check-in counters, which will be moved to the opposite side of the area. In the arrivals section, after passport control and customs, a café and ATM will be added along one side of the building. Moreover, a new car hire service is planned, necessitating an expansion of the facility.
保安検査前と税関後には、いくつかの変更が予定されている。出発ゾーンでは、新たな入り口が導入され、カフェは斜め向かいに移転される。既存のチェックインカウンターは、エリアの反対側に移動され、新しい手荷物預かり所が設置される。到着セクションでは、パスポートコントロールと税関の後に、カフェとATMが建物の片側に追加される。さらに、新しいレンタカーサービスが計画されており、施設の拡張が必要となる。
ポイント解説
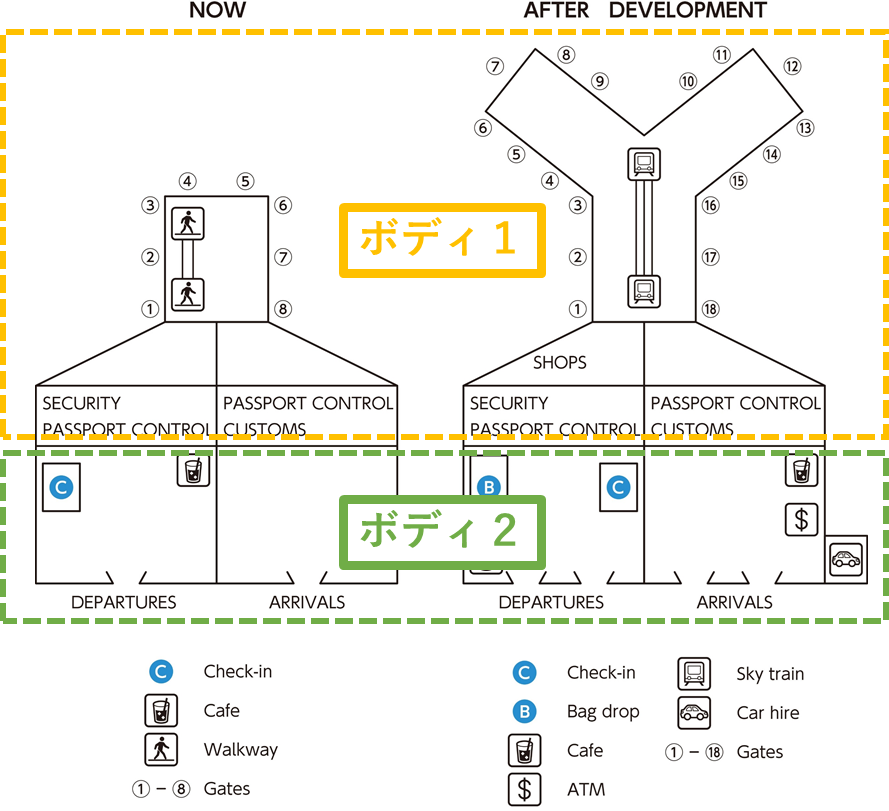
イントロダクション
1文目:問題文のパラフレイズ
- 問題文のパラフレイズについてはこちら
(問題文)The plans below show the site of an airport now and how it will look after redevelopment next year.
⇓ ⇓ ⇓
(パラフレイズ)The map outlines proposed renovation plans for Southwest Airport, scheduled to be implemented next year.
この地図は、来年実施予定のサウスウエスト空港の改修計画の概要を示している。
2文目:Overall
- Overallについてはこちら
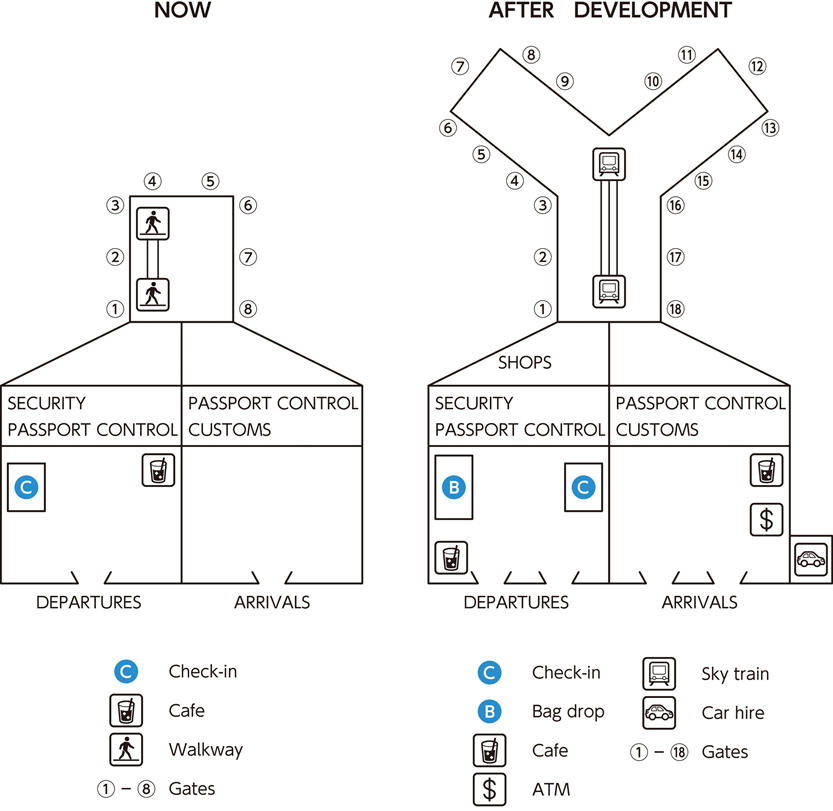
Overall 1文目
Overall, the redevelopment aims to increase the number of boarding gates, introduce additional amenities, and relocate some existing facilities for improved efficiency and passenger experience.
全体として、再開発は搭乗ゲートの数を増やし、追加のアメニティを導入し、効率と乗客体験を向上させるために既存の施設の一部を移転することを目的としている。
イントロダクションパラグラフ全体
The map outlines proposed renovation plans for Southwest Airport, scheduled to be implemented next year. Overall, the redevelopment aims to increase the number of boarding gates, introduce additional amenities, and relocate some existing facilities for improved efficiency and passenger experience.
この地図は、来年実施予定のサウスウエスト空港の改修計画の概要を示している。全体として、再開発は搭乗ゲートの数を増やし、追加のアメニティを導入し、効率と乗客体験を向上させるために既存の施設の一部を移転することを目的としている。
ボディ1
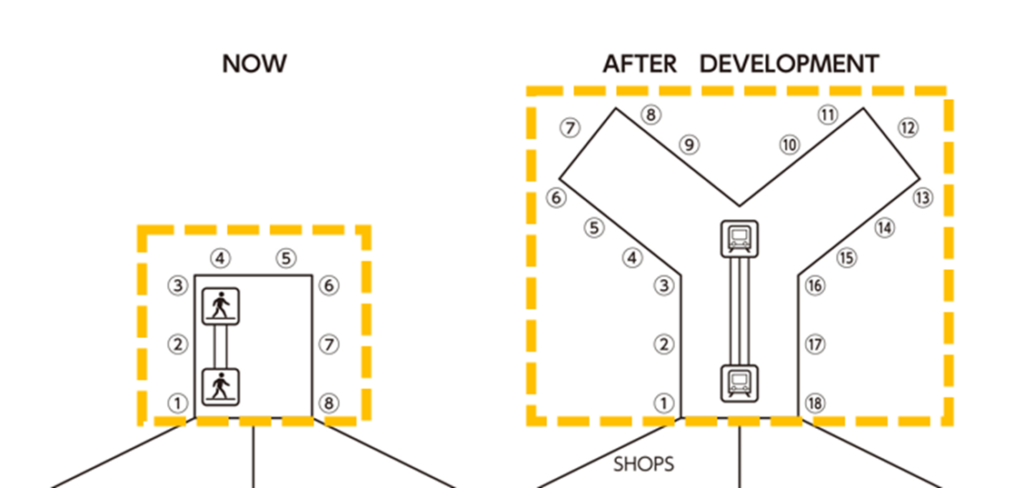
ボディ1 1文目
四角形の8つの搭乗ゲートがY字型の18の搭乗ゲートに拡大される予定。
In the boarding area, the current rectangular layout with eight gates will be expanded into a Y-shaped design featuring 18 gates.
搭乗エリアでは、現在の8つのゲートを持つ長方形のレイアウトを拡大し、18のゲートを持つY字型のデザインにする予定である。
- サイズが分かる表現(expanded)はこちら
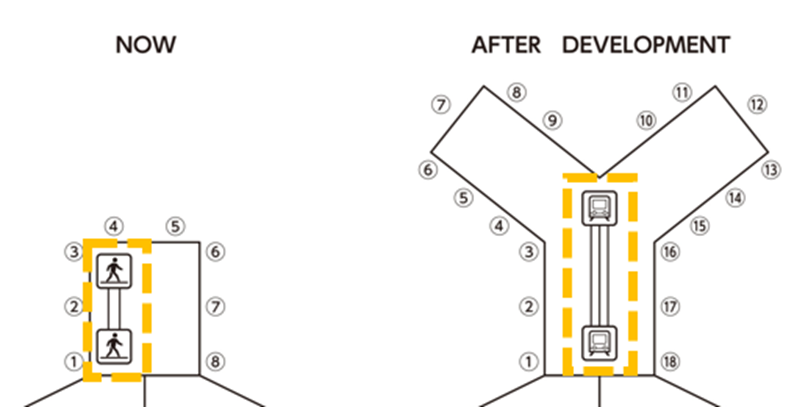
ボディ1 2文目
walkwayはsky trainになる予定。
The existing walkway will be replaced with a modern sky train to provide quicker access to the gates.
既存の通路は、より迅速にゲートにアクセスできるように、近代的なスカイトレインに置き換えられる。
- 変わる・違う用途になる表現(replaced with)はこちら
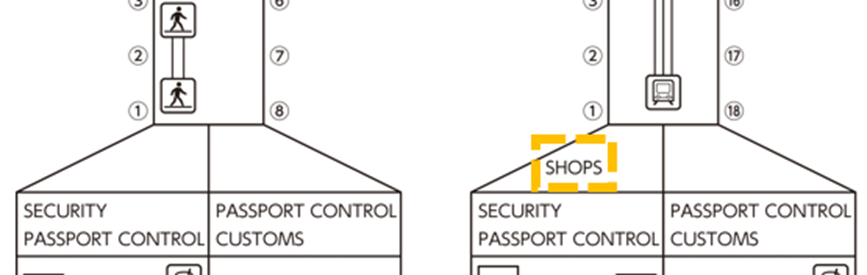
ボディ1 3文目
新しくshopsがSecurity passport controlの後に追加させる予定。
Furthermore, new retail shops are added to open beyond the security and passport control zone.
さらに、セキュリティとパスポートコントロールゾーンの後に新しい小売店が追加される。
- 変わる・加わる(added)の表現はこちら

ボディ1 4文目
Security passport control(出発)とPassport control customs(到着)は変わらない。
However, the departure and arrival entrances will remain in their current locations.
出発と到着の入り口は現在の場所で変わらない予定である。
- 変わらない(remain)の表現はこちら
ボディ1全体
In the boarding area, the current rectangular layout with eight gates will be expanded into a Y-shaped design featuring 18 gates. The existing walkway will be replaced with a modern sky train to provide quicker access to the gates. Furthermore, new retail shops are added to open beyond the security and passport control zone. However, the departure and arrival entrances will remain in their current locations.
搭乗エリアでは、現在の8つのゲートを持つ長方形のレイアウトを拡大し、18のゲートを持つY字型のデザインにする予定である。既存の通路は、より迅速にゲートにアクセスできるように、近代的なスカイトレインに置き換えられる。さらに、セキュリティとパスポートコントロールゾーンの後に新しい小売店が追加される。出発と到着の入り口は現在の場所で変わらない予定である。
ボディ2
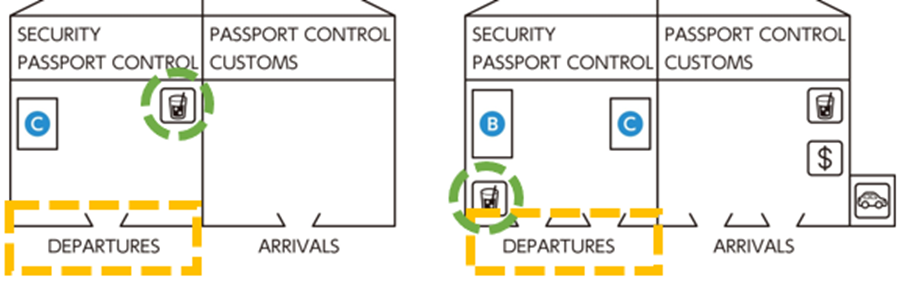
ボディ2 1文目&2文目
Departure(出発)エリアの入り口が追加されて(オレンジ)、caféが対角線上の反対側に移った(緑)。
Before security and after customs, several changes are planned. In the departure zone, an additional entrance will be introduced, and the café will be relocated to a diagonally opposite position.
保安検査前と税関後には、いくつかの変更が予定されている。出発ゾーンでは、新たな入り口が導入され、カフェは斜め向かいに移転される。
- 変わる・場所が変わる(relocated)の表現はこちら
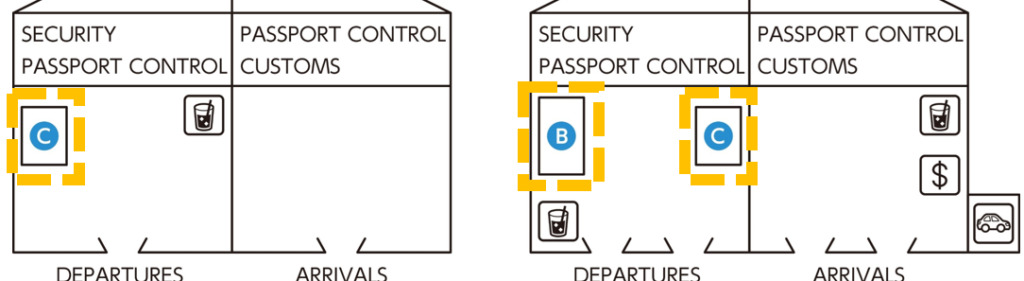
ボディ2 3文目
Arrival(到着)エリアにはcaféとATMが追加された。
In the arrivals section, after passport control and customs, a café and ATM will be added along one side of the building.
到着セクションでは、パスポートコントロールと税関の後に、カフェとATMが建物の片側に追加される。
- 変わる・加わる(added)の表現はこちら
ボディ2 4文目
Car hireが新しく予定されており、それには設備の拡大が必要の予定。
Moreover, a new car hire service is planned, necessitating an expansion of the facility.
さらに、新しいレンタカーサービスが計画されており、施設の拡張が必要となる。
- 分詞構文(necessitating)を使って表現
ボディ2全体
Before security and after customs, several changes are planned. In the departure zone, an additional entrance will be introduced, and the café will be relocated to a diagonally opposite position. A new bag-drop facility will replace the existing check-in counters, which will be moved to the opposite side of the area. In the arrivals section, after passport control and customs, a café and ATM will be added along one side of the building. Moreover, a new car hire service is planned, necessitating an expansion of the facility.
保安検査前と税関後には、いくつかの変更が予定されている。出発ゾーンでは、新たな入り口が導入され、カフェは斜め向かいに移転される。既存のチェックインカウンターは、エリアの反対側に移動され、新しい手荷物預かり所が設置される。到着セクションでは、パスポートコントロールと税関の後に、カフェとATMが建物の片側に追加される。さらに、新しいレンタカーサービスが計画されており、施設の拡張が必要となる。
地図 その2
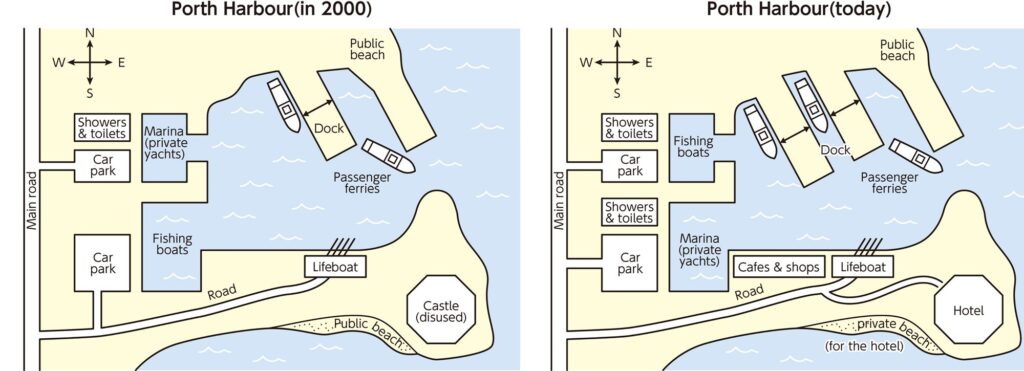
サンプル回答&ポイント解説
サンプル回答
The maps illustrate the evolution of Porth Harbour from 2000 to the present. Overall, the harbour has undergone significant changes, including the expansion of docking spaces, the addition of new facilities, and a reconfiguration of its existing utilities.
この地図は、2000年から現在までのポースハーバーの発展を示している。港は全体的に、ドッキングスペースの拡張、新しい施設の追加、既存のユーティリティの再構成など、大きな変化を遂げている。
Historically, the northern section of the harbour featured a single dock, situated below a public beach that extended further north. The beach remains unchanged, but a new dock serving passenger ferries has been introduced. To the south and west of the docks, there was previously a marina for private yachts, along with showers, toilets, and a car park connected to the main road running north to south. The only notable change in this area is the replacement of the marina with a harbour designated for fishing boats, which was previously located in the southwestern part of the harbour.
昔は、港の北側のセクションには、さらに北に伸びる公共ビーチ(Public beach)の下にドック(Dock)があった。ビーチは変更されていないが、旅客フェリーが発着する新しいドックが建設された。ドックの南西側には、以前はプライベートヨットのためのマリーナ(Marina)、シャワー、トイレ、南北に走る幹線道路に接続された駐車場(Car park)があった。このエリアの唯一の注目すべき変化は、以前は港の南西部にあった漁船用の港(Fishing boats)がマリーナ(Marina)に置き換えられたことである。
In the southwestern area, a new facility containing showers and toilets has been constructed on the north side of the car park, which now connects directly to the main road. These new amenities are situated adjacent to the former fishing boat harbour, which has now been replaced by the marina. On the eastern peninsula, new cafes and shops have been built next to the lifeboat station. Additionally, the castle at the furthest eastern point has been converted into a hotel, linked to the newly laid small road. The private beach to the south has been designated for exclusive use by hotel guests.
南西部では、駐車場の北側にシャワーとトイレを備えた新しい施設が建設され、駐車場は幹線道路に直結された。これらの新しい設備は、現在マリーナ(Marina)に変わった以前の漁船用の港(Fishing boats)に隣接している。東半島では、新しいカフェやショップ(Cafes & shops)が救命ボート乗り場(Lifeboat)の隣に建てられている。さらに、最も東の端にある城(Castle)はホテル(Hotel)に改装され、新しく敷設された小さな道路につながっている。南側のプライベートビーチは、ホテルの宿泊客専用ビーチになっている。
ポイント解説
イントロダクション
1文目:問題文のパラフレイズ
- 問題文のパラフレイズについてはこちら
(問題文)The plans below show a harbour in 2000 and how it looks today.
⇓ ⇓ ⇓
(パラフレイズ)The maps illustrate the evolution of Porth Harbour from 2000 to the present.
この地図は、2000年から現在までのポースハーバーの発展を示している。
2文目:Overall
- Overallについてはこちら
Overall 1文目
Overall, the harbour has undergone significant changes, including the expansion of docking spaces, the addition of new facilities, and a reconfiguration of its existing utilities.
港は全体的に、ドッキングスペースの拡張、新しい施設の追加、既存のユーティリティの再構成など、大きな変化を遂げている。
イントロダクションパラグラフ全体
The maps illustrate the evolution of Porth Harbour from 2000 to the present. Overall, the harbour has undergone significant changes, including the expansion of docking spaces, the addition of new facilities, and a reconfiguration of its existing utilities.
この地図は、2000年から現在までのポースハーバーの発展を示している。港は全体的に、ドッキングスペースの拡張、新しい施設の追加、既存のユーティリティの再構成など、大きな変化を遂げている。
ボディ1
ボディ1 1文目
以前はHarbourの北南側(地図の右上側)にDockが1つ北側に伸びるPublic beachの下側にあった。Public beachはそのままで、Dockはもう一つ増えた。
Historically, the northern section of the harbour featured a single dock, situated below a public beach that extended further north. The beach remains unchanged, but a new dock serving passenger ferries has been introduced.
昔は、港の北側のセクションには、さらに北に伸びる公共ビーチ(Public beach)の下にドック(Dock)があった。ビーチは変更されていないが、旅客フェリーが発着する新しいドックが建設された。
- 変わらない(remain)の表現はこちら
ボディ1 2文目
北西側(地図の左上側)はかつてはprivate yacht用のmarinaが、Showers&Toiletとmain roadにつながるCar parkに沿ってあった。
To the south and west of the docks, there was previously a marina for private yachts, along with showers, toilets, and a car park connected to the main road running north to south.
ドックの南西側には、以前はプライベートヨットのためのマリーナ(Marina)、シャワー、トイレ、南北に走る幹線道路に接続された駐車場(Car park)があった。
- 場所にある(there was )の表現はこちら
ボディ1 3文目
(2文目に続いて)北西側(地図の左上側)の変更点は、private yacht用のmarinaがかつては南側にあったFishing boats用のharbourになった。
The only notable change in this area is the replacement of the marina with a harbour designated for fishing boats, which was previously located in the southwestern part of the harbour.
このエリアの唯一の注目すべき変化は、以前は港の南西部にあった漁船用の港(Fishing boats)がマリーナ(Marina)に置き換えられたことである。
- 変わる・違う用途になる(replacement — with)の表現はこちら
ボディ1全体
Historically, the northern section of the harbour featured a single dock, situated below a public beach that extended further north. The beach remains unchanged, but a new dock serving passenger ferries has been introduced. To the south and west of the docks, there was previously a marina for private yachts, along with showers, toilets, and a car park connected to the main road running north to south. The only notable change in this area is the replacement of the marina with a harbour designated for fishing boats, which was previously located in the southwestern part of the harbour.
昔は、港の北側のセクションには、さらに北に伸びる公共ビーチ(Public beach)の下にドック(Dock)があった。ビーチは変更されていないが、旅客フェリーが発着する新しいドックが建設された。ドックの南西側には、以前はプライベートヨットのためのマリーナ(Marina)、シャワー、トイレ、南北に走る幹線道路に接続された駐車場(Car park)があった。このエリアの唯一の注目すべき変化は、以前は港の南西部にあった漁船用の港(Fishing boats)がマリーナ(Marina)に置き換えられたことである。
ボディ2
ボディ2 1文目
南西側(地図の左下側)ではShowers&ToiletsがCar parkの北側に建設された(オレンジ)。駐車場はいまmain roadに直接つながっている(緑)。これらのShowers&ToiletsとCar parkはMarina(むかしのFishing boat harbour)に沿って(紫)立っている。
In the southwestern area, a new facility containing showers and toilets has been constructed on the north side of the car park, which now connects directly to the main road. These new amenities are situated adjacent to the former fishing boat harbour, which has now been replaced by the marina.
南西部では、駐車場の北側にシャワーとトイレを備えた新しい施設が建設され、駐車場は幹線道路に直結された。これらの新しい設備は、現在マリーナ(Marina)に変わった以前の漁船用の港(Fishing boats)に隣接している。
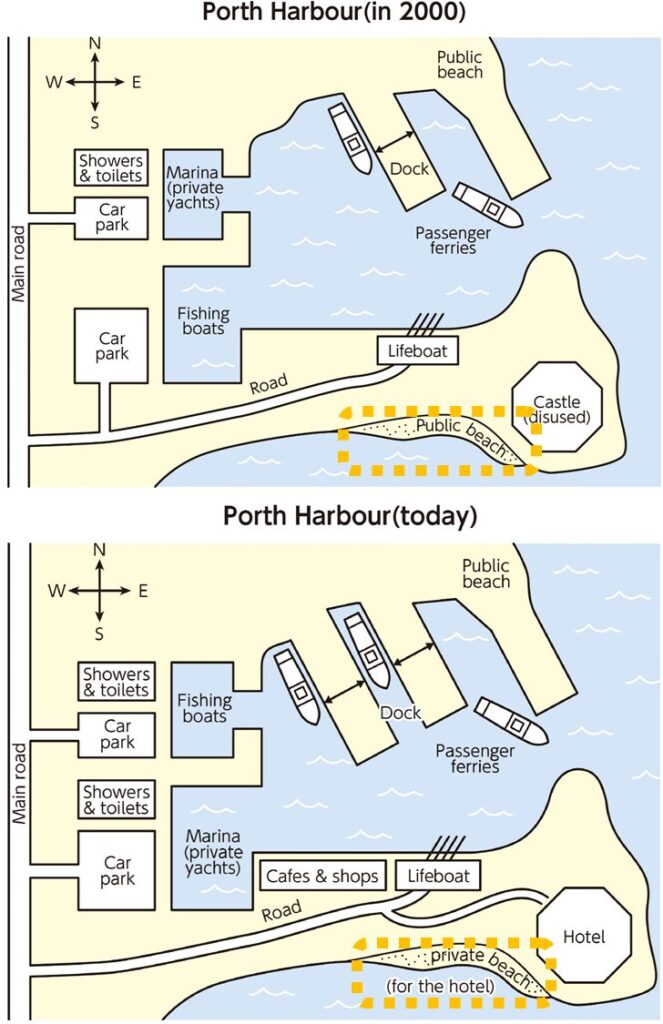
ボディ2 4文目
Public beachはホテルのゲスト用のPrivate beachになった。
The private beach to the south has been designated for exclusive use by hotel guests.
南側のプライベートビーチは、ホテルの宿泊客専用ビーチになっている。
ボディ2全体
In the southwestern area, a new facility containing showers and toilets has been constructed on the north side of the car park, which now connects directly to the main road. These new amenities are situated adjacent to the former fishing boat harbour, which has now been replaced by the marina. On the eastern peninsula, new cafes and shops have been built next to the lifeboat station. Additionally, the castle at the furthest eastern point has been converted into a hotel, linked to the newly laid small road. The private beach to the south has been designated for exclusive use by hotel guests.
南西部では、駐車場の北側にシャワーとトイレを備えた新しい施設が建設され、駐車場は幹線道路に直結された。これらの新しい設備は、現在マリーナ(Marina)に変わった以前の漁船用の港(Fishing boats)に隣接している。東半島では、新しいカフェやショップ(Cafes & shops)が救命ボート乗り場(Lifeboat)の隣に建てられている。さらに、最も東の端にある城(Castle)はホテル(Hotel)に改装され、新しく敷設された小さな道路につながっている。南側のプライベートビーチは、ホテルの宿泊客専用ビーチになっている。
プロセス その1
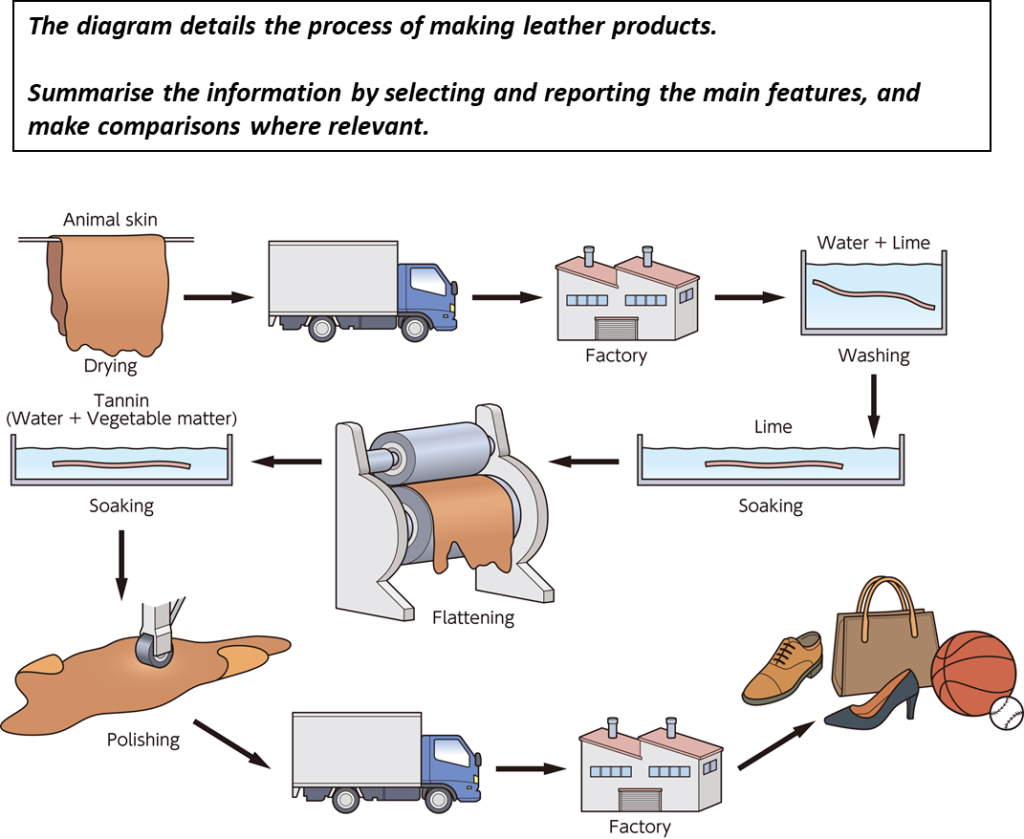
サンプル回答&ポイント解説
サンプル回答
The diagram illustrates the process by which leather products are manufactured from animal skins for retail. Overall, this linear process consists of eleven stages, beginning with the transportation of raw materials to the factory, followed by their preparation and processing, and culminating in the production of consumer goods.
図は動物の皮から革製品が製造されるプロセスを示している。全体として、この直線的なプロセスは11の段階で構成されており、原材料の工場への輸送から始まり、その準備と加工、そして最終的に消費財の生産に至る。
Initially, the leather skins, sourced from various animals, are dried before being transported to the factory. In the first stage, the skins are thoroughly washed with water and lime in a large container, after which the individual sheets are soaked in another container filled with lime. The skins are then pressed using a machine with rollers to flatten them.
まず、さまざまな動物から調達された皮を乾燥させてから工場に輸送する。最初の段階では、皮は大きな容器の中で水と石灰で徹底的に洗浄され、その後、個々のシートは石灰を入れた別の容器に浸される。その後、ローラー付きの機械で皮をプレスして平らにします。
Subsequently, the flattened skins are immersed in tannin, a liquid composed of water and vegetable matter. After soaking, the skins are polished with rolling equipment before being transferred by lorry to another factory, where they are fashioned into final leather products, such as bags, shoes, and balls.
次に、平らにした皮をタンニン(Tannin)という水と植物性の液体に浸します。浸けた後、皮は圧延機で研磨されます。その後、トラックで別の工場に運ばれ、バッグや靴、ボールなどの最終的な革製品に加工されます。
ポイント解説
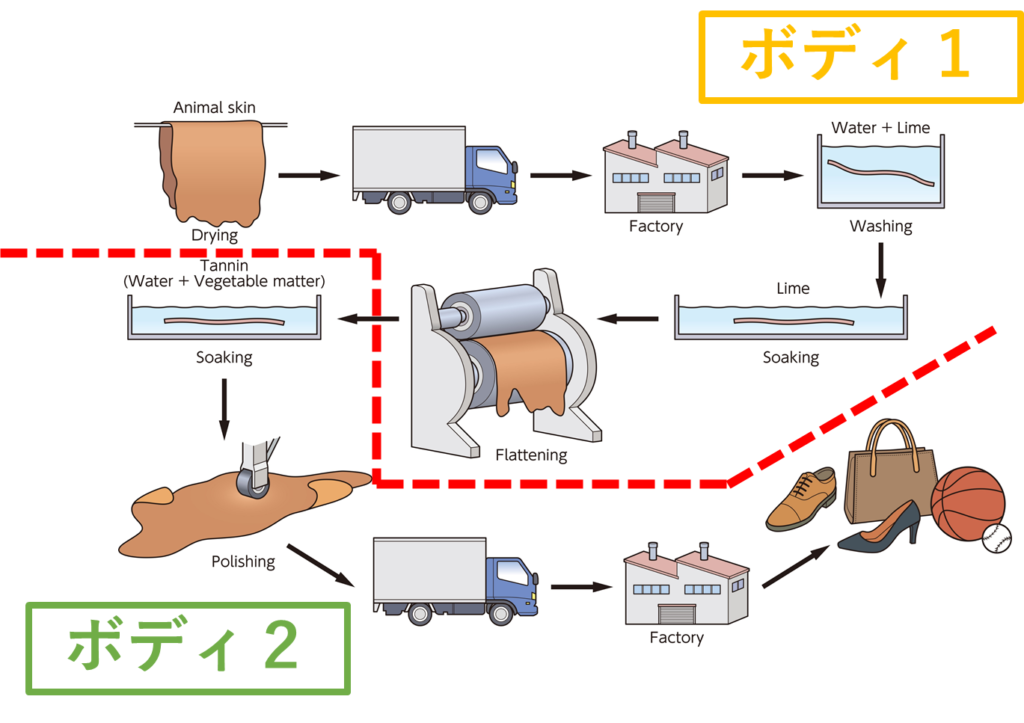
イントロダクション
1文目:問題文のパラフレイズ
- 問題文のパラフレイズについてはこちら
(問題文)The diagram details the process of making leather products.
⇓ ⇓ ⇓
(パラフレイズ)The diagram illustrates the process by which leather products are manufactured from animal skins for retail.
図は動物の皮から革製品が製造されるプロセスを示している。
2文目:Overall
- Overallについてはこちら

Overall 1文目
Overall, this linear process consists of eleven stages, beginning with the transportation of raw materials to the factory, followed by their preparation and processing, and culminating in the production of consumer goods.
全体として、この直線的なプロセスは11の段階で構成されており、原材料の工場への輸送から始まり、その準備と加工、そして最終的に消費財の生産に至る。
- プロセスのOverallの流れの書き方はこちら
イントロダクションパラグラフ全体
The diagram illustrates the process by which leather products are manufactured from animal skins for retail. Overall, this linear process consists of eleven stages, beginning with the transportation of raw materials to the factory, followed by their preparation and processing, and culminating in the production of consumer goods.
図は動物の皮から革製品が製造されるプロセスを示している。全体として、この直線的なプロセスは11の段階で構成されており、原材料の工場への輸送から始まり、その準備と加工、そして最終的に消費財の生産に至る。
ボディ1
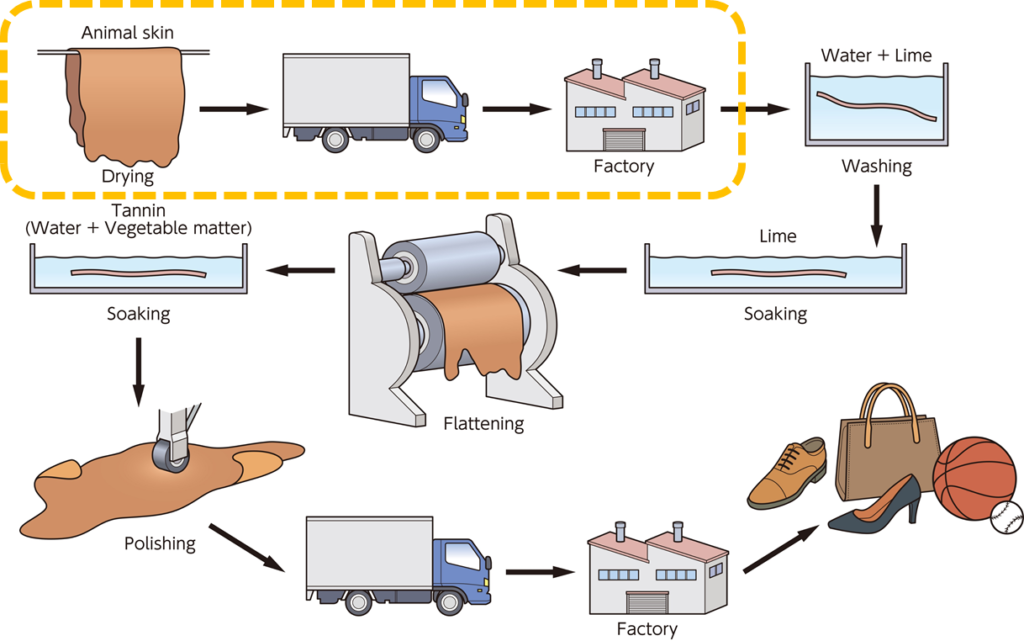
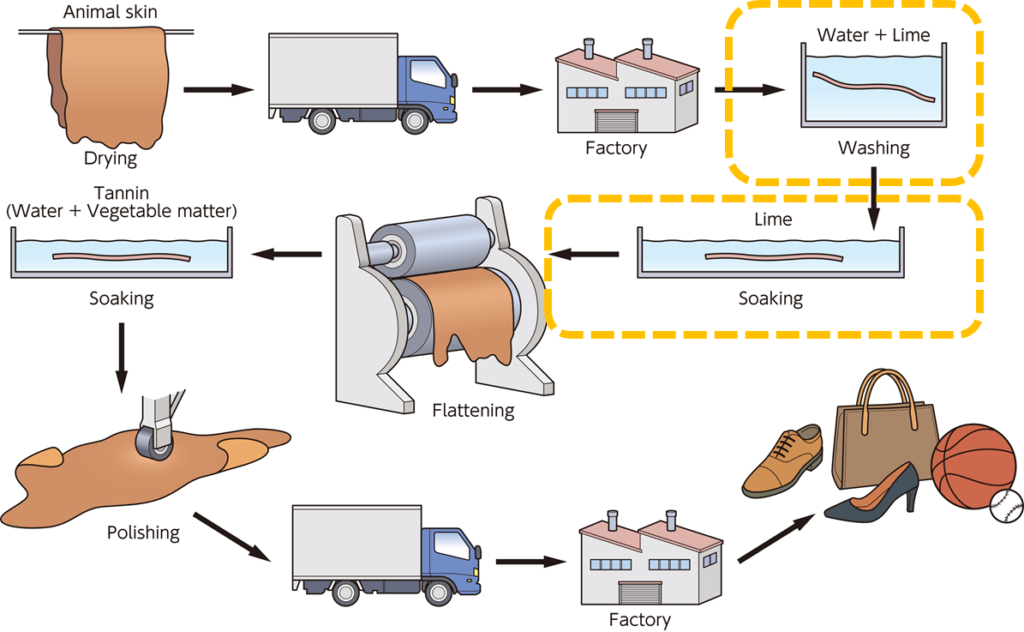
ボディ1 2文目
工場での最初の段階では、皮はwater and limeが入った容器で洗われ、その次に皮はlimeの入った容器に1枚づつ入れられる。
In the first stage, the skins are thoroughly washed with water and lime in a large container, after which the individual sheets are soaked in another container filled with lime.
最初の段階では、皮は大きな容器の中で水と石灰で徹底的に洗浄され、その後、個々のシートは石灰を入れた別の容器に浸される。
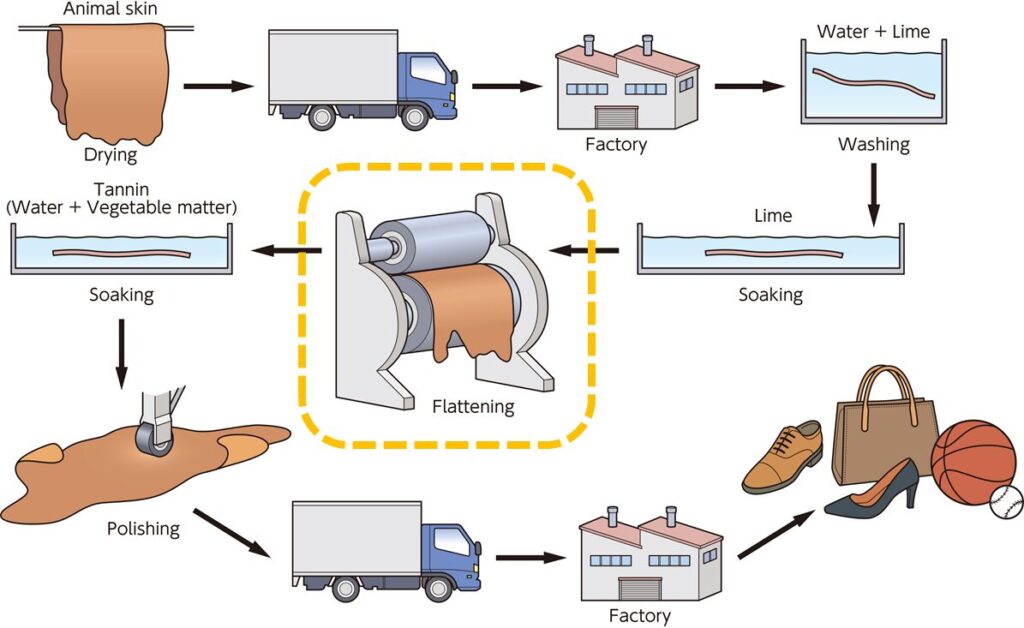
ボディ1 3文目
皮はローラーがついた機械を使ってプレスされる。
The skins are then pressed using a machine with rollers to flatten them.
その後、ローラー付きの機械で皮をプレスして平らにします。
- 順番を表す単語(then)はこちら
ボディ1全体
Initially, the leather skins, sourced from various animals, are dried before being transported to the factory. In the first stage, the skins are thoroughly washed with water and lime in a large container, after which the individual sheets are soaked in another container filled with lime. The skins are then pressed using a machine with rollers to flatten them.
まず、さまざまな動物から調達された皮を乾燥させてから工場に輸送する。最初の段階では、皮は大きな容器の中で水と石灰で徹底的に洗浄され、その後、個々のシートは石灰を入れた別の容器に浸される。その後、ローラー付きの機械で皮をプレスして平らにします。
ボディ2
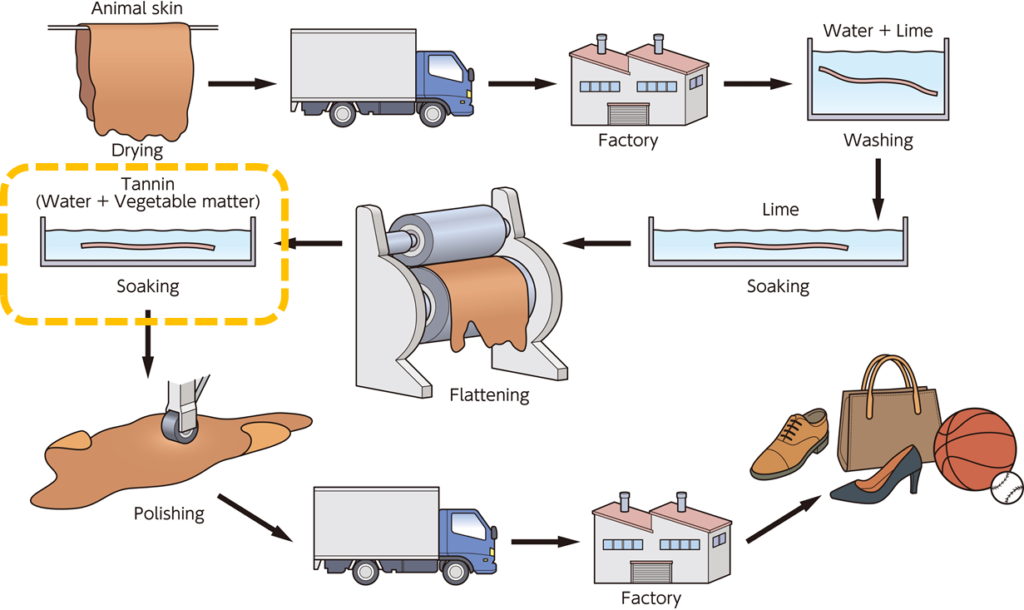
ボディ2 1文目
続いて、平たくなった皮はtannin(=water and vegetable matterのミックス)に浸される。
Subsequently, the flattened skins are immersed in tannin, a liquid composed of water and vegetable matter.
次に、平らにした皮をタンニン(Tannin)という水と植物性の液体に浸します。
- 順番を表す単語(Subsequently)はこちら
- tannin, a liquid composed of water and vegetable matterは”,”同格でtanninの説明をしています。
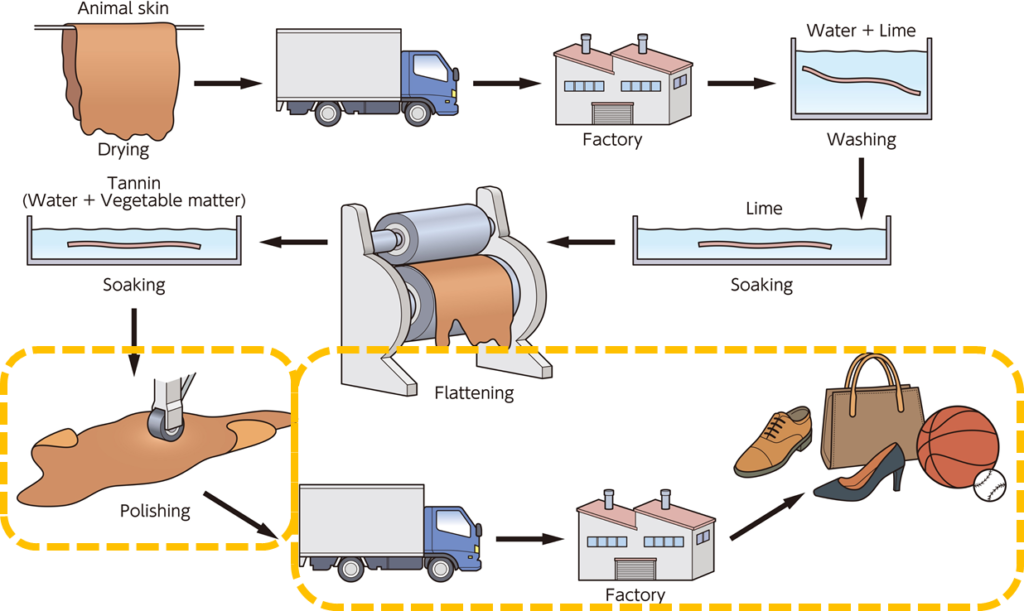
ボディ2 1文目
(tannin)に浸された後は、皮はローラーの付いた機械で磨かれて、もう一つの工場に運ばれてそこでバックや靴、ボールなどの革製品が作られる。
After soaking, the skins are polished with rolling equipment before being transferred by lorry to another factory, where they are fashioned into final leather products, such as bags, shoes, and balls.
浸けた後、皮は圧延機で研磨されます。その後、トラックで別の工場に運ばれ、バッグや靴、ボールなどの最終的な革製品に加工されます。
ボディ2全体
Subsequently, the flattened skins are immersed in tannin, a liquid composed of water and vegetable matter. After soaking, the skins are polished with rolling equipment before being transferred by lorry to another factory, where they are fashioned into final leather products, such as bags, shoes, and balls.
次に、平らにした皮をタンニン(Tannin)という水と植物性の液体に浸します。浸けた後、皮は圧延機で研磨されます。その後、トラックで別の工場に運ばれ、バッグや靴、ボールなどの最終的な革製品に加工されます。
プロセス その2
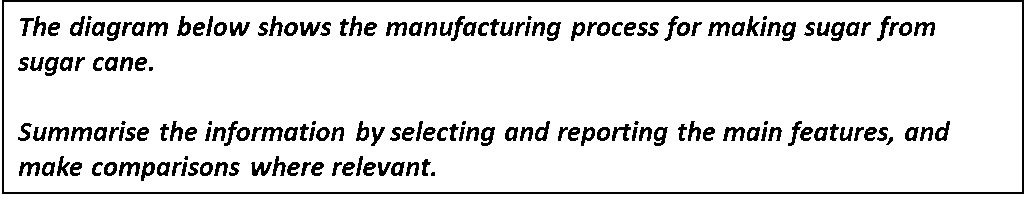
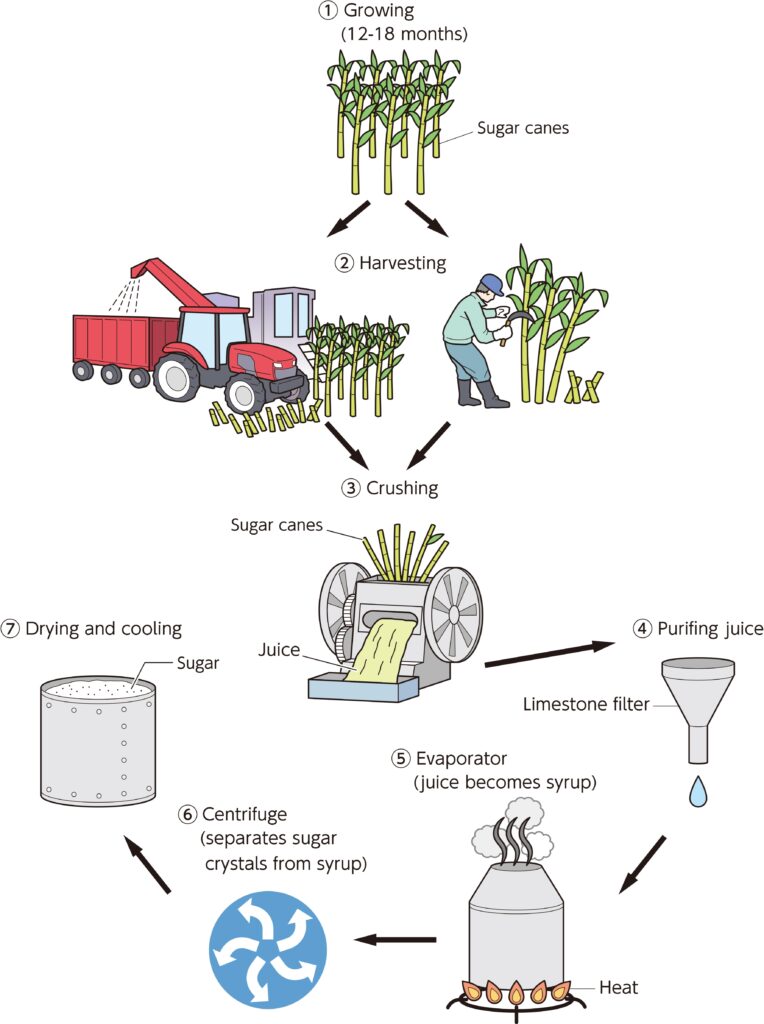
サンプル回答&ポイント解説
サンプル回答
The diagram illustrates the process by which sugar is manufactured from sugar cane. Overall, the linear process consists of seven stages, starting with the cultivation of sugar cane plants and concluding with the production of edible sugar by drying and cooling the sugar crystals.
この図は、サトウキビから砂糖が製造されるプロセスを示しています。全体として、直線的なプロセスは7つの段階で構成されています。サトウキビの栽培から始まり、砂糖の結晶を乾燥させて冷却することで食用の砂糖を製造することで終わります。
The first step involves growing the sugar cane, which takes between one and one and a half years to mature. Once fully grown, the cane is harvested either manually or mechanically. The manual method entails farmers cutting the stalks with an axe, while the mechanised method employs agricultural machinery to collect the plants in large quantities.
最初のステップはサトウキビの栽培で、成熟するまでに1年~1年半かかります。完全に成長したら、サトウキビは手作業または機械で収穫されます。手作業では農家が斧で茎を切る必要がありますが、機械化された方法では農業機械を使用して植物を大量に収集します。
After harvesting, the cane is crushed using equipment to extract the juice, which is then purified through a limestone filter. The purified juice is subsequently boiled in an evaporation pot, where it condenses into syrup as it is heated. The syrup is then poured into a centrifuge, where the sugar crystals are separated from the syrup. Finally, the extracted sugar crystals are dried and cooled in a cylindrical container, resulting in the production of edible sugar.
収穫後、サトウキビは機械を使用して粉砕され、液体(juice)が抽出されます。その後、石灰石フィルター(Limestone filter)で精製されます。その後、精製されたジュースは蒸発鍋で煮沸され、加熱されるとシロップに凝縮されます。シロップを遠心分離器に流し込み、シロップから糖の結晶を分離します。最後に、抽出された糖の結晶を乾燥させ、円筒状の容器に入れて冷却し、食用糖を製造する。
ポイント解説
イントロダクション
1文目:問題文のパラフレイズ
- 問題文のパラフレイズについてはこちら
(問題文)The diagram below shows the manufacturing process for making sugar from sugar cane.
⇓ ⇓ ⇓
(パラフレイズ)The diagram illustrates the process by which sugar is manufactured from sugar cane.
この図は、サトウキビから砂糖が製造されるプロセスを示しています。
2文目:Overall
- Overallについてはこちら
Overall 1文目
このプロセスは7つのステップ(①~⑦:consists of seven stages)からなる線形的(linear process)なプロセス。
Overall, the linear process consists of seven stages, starting with the cultivation of sugar cane plants and concluding with the production of edible sugar by drying and cooling the sugar crystals.
全体として、直線的なプロセスは7つの段階で構成されています。サトウキビの栽培から始まり、砂糖の結晶を乾燥させて冷却することで食用の砂糖を製造することで終わります。
- プロセスのlinearかcircularかについてはこちら
イントロダクションパラグラフ全体
The diagram illustrates the process by which sugar is manufactured from sugar cane. Overall, the linear process consists of seven stages, starting with the cultivation of sugar cane plants and concluding with the production of edible sugar by drying and cooling the sugar crystals.
この図は、サトウキビから砂糖が製造されるプロセスを示しています。全体として、直線的なプロセスは7つの段階で構成されています。サトウキビの栽培から始まり、砂糖の結晶を乾燥させて冷却することで食用の砂糖を製造することで終わります。
ボディ1
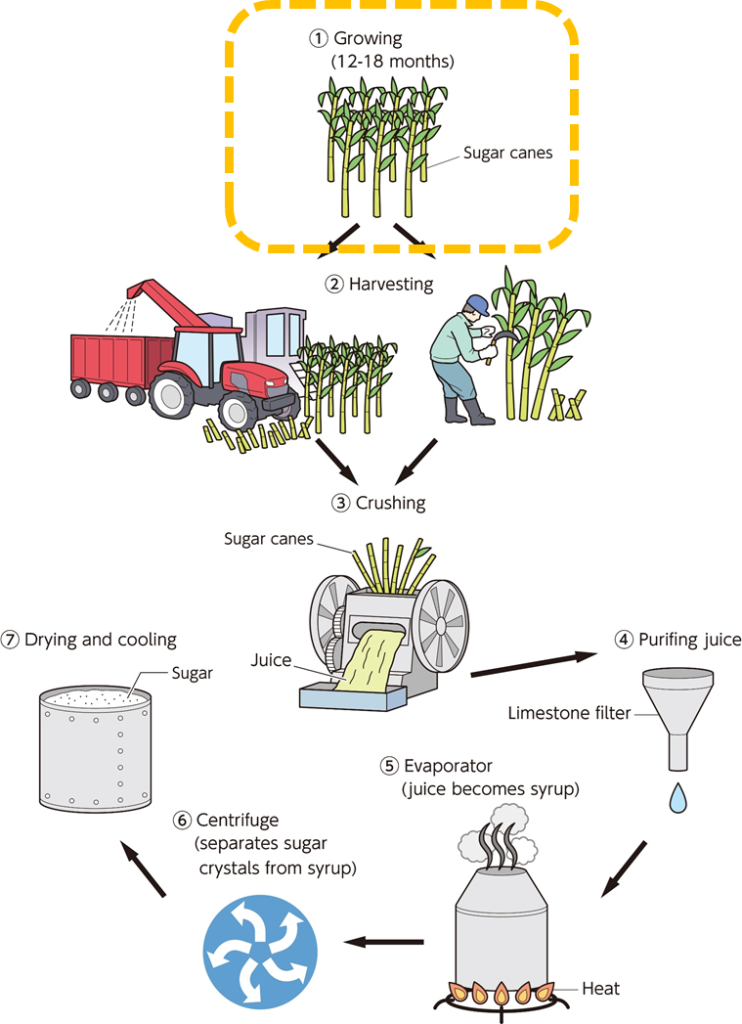
ボディ1 1文目
はじめにサトウキビ(sugar cane)が育てられ、それが育つのには1年~1年半かかる。
The first step involves growing the sugar cane, which takes between one and one and a half years to mature.
最初のステップはサトウキビの栽培で、成熟するまでに1年~1年半かかります。
- 順番を表す単語(The first step)はこちら
- 12-18monthsをone and one and a half yearsにパラフレイズしました。
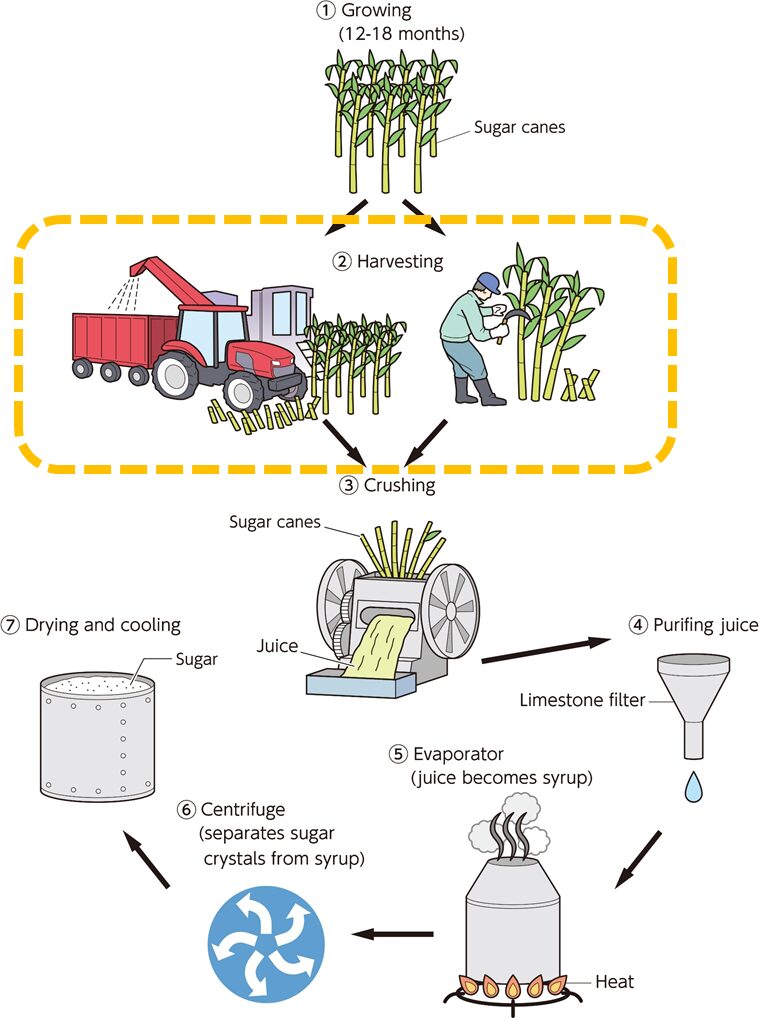
ボディ1 2文目&3文目
Once fully grown, the cane is harvested either manually or mechanically. The manual method entails farmers cutting the stalks with an axe, while the mechanised method employs agricultural machinery to collect the plants in large quantities.
完全に成長したら、サトウキビは手作業または機械で収穫されます。手作業では農家が斧で茎を切る必要がありますが、機械化された方法では農業機械を使用して植物を大量に収集します。
ボディ1全体
The first step involves growing the sugar cane, which takes between one and one and a half years to mature. Once fully grown, the cane is harvested either manually or mechanically. The manual method entails farmers cutting the stalks with an axe, while the mechanised method employs agricultural machinery to collect the plants in large quantities.
最初のステップはサトウキビの栽培で、成熟するまでに1年~1年半かかります。完全に成長したら、サトウキビは手作業または機械で収穫されます。手作業では農家が斧で茎を切る必要がありますが、機械化された方法では農業機械を使用して植物を大量に収集します。
ボディ2
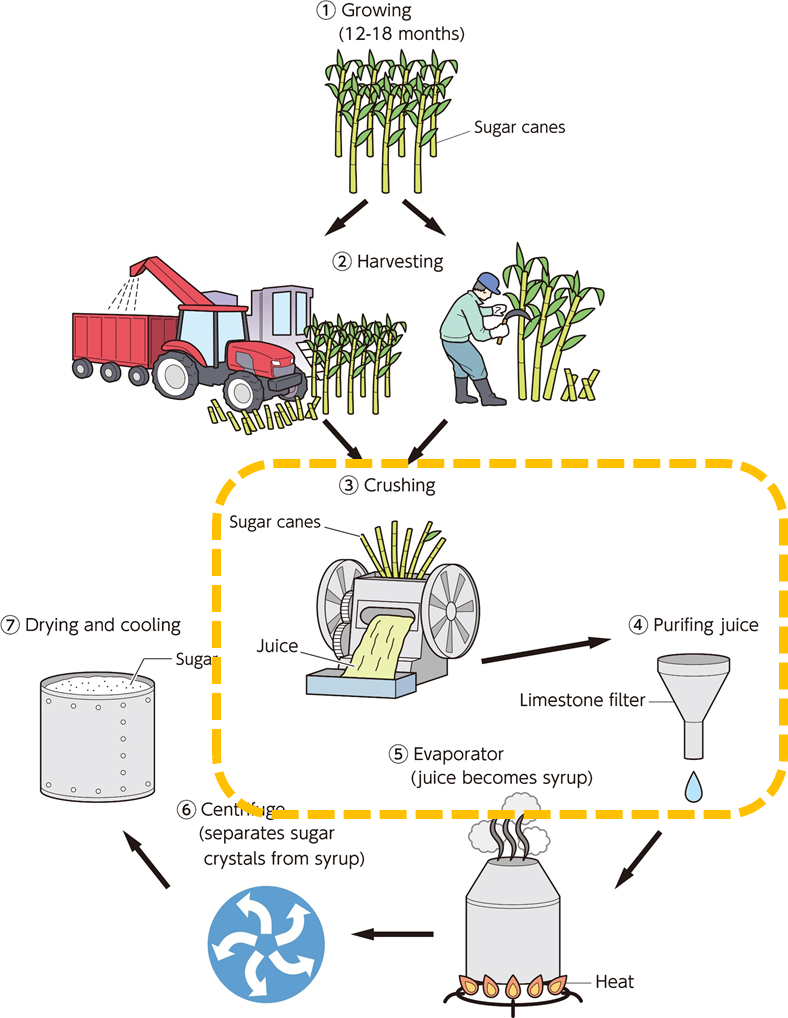
ボディ2 1文目
収穫の後にサトウキビは機械を使ってジュース状になり、limestone filterを使って濾される。
After harvesting, the cane is crushed using equipment to extract the juice, which is then purified through a limestone filter.
収穫後、サトウキビは機械を使用して粉砕され、液体(juice)が抽出されます。その後、石灰石フィルター(Limestone filter)で精製されます。
- 順番を表す単語(After)はこちら
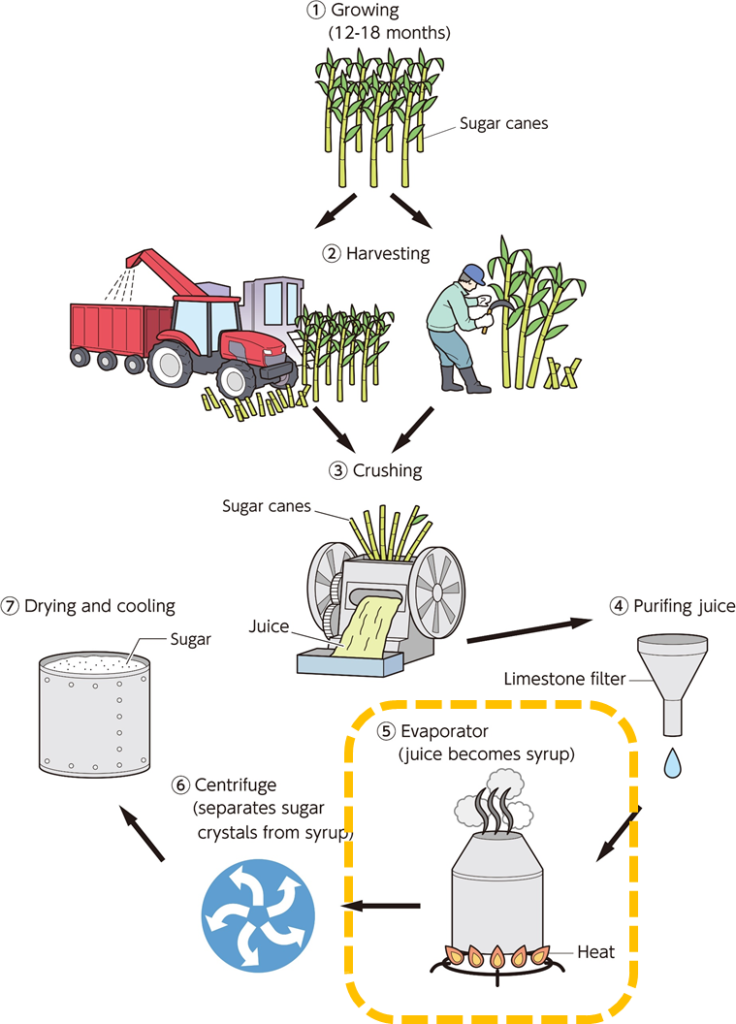
ボディ2 2文目
濾されたジュースはその次にポットで加熱されてシロップになる。
The purified juice is subsequently boiled in an evaporation pot, where it condenses into syrup as it is heated.
その後、精製されたジュースは蒸発鍋で煮沸され、加熱されるとシロップに凝縮されます。
- 順番を表す単語(subsequently)はこちら
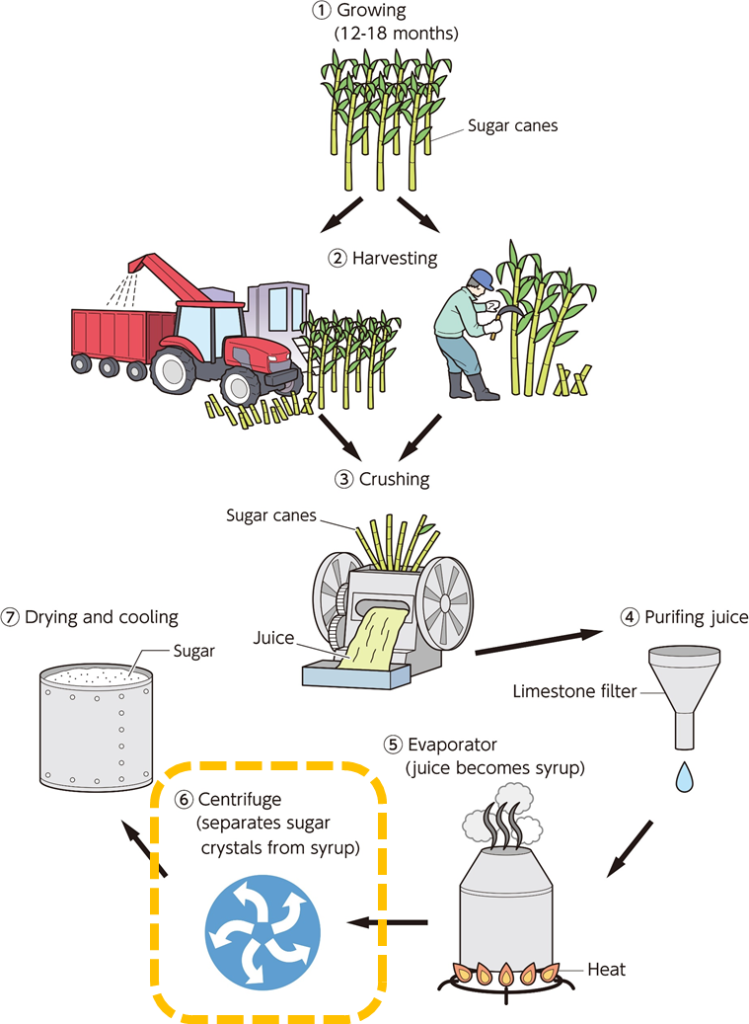
ボディ2 3文目
シロップは遠心分離機(回転させて比重の違いで遠心力で分離させる装置)に注がれ、シロップと結晶が分離される。
The syrup is then poured into a centrifuge, where the sugar crystals are separated from the syrup.
シロップを遠心分離器に流し込み、シロップから糖の結晶を分離します。
- 順番を表す単語(then)はこちら
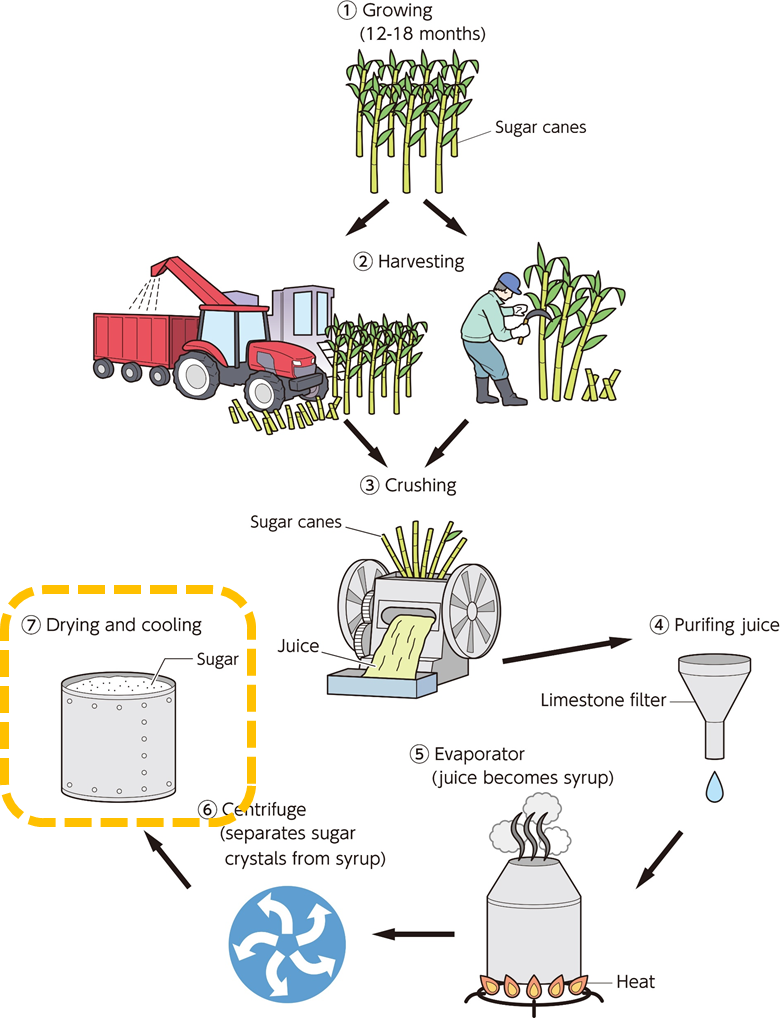
ボディ2 4文目
最終的に、分離された砂糖の結晶はシリンダ状の容器で乾燥・冷却され、食用の砂糖ができる。
Finally, the extracted sugar crystals are dried and cooled in a cylindrical container, resulting in the production of edible sugar.
最後に、抽出された糖の結晶を乾燥させ、円筒状の容器に入れて冷却し、食用糖を製造する。
- 順番を表す単語(Finally)はこちら
ボディ2全体
After harvesting, the cane is crushed using equipment to extract the juice, which is then purified through a limestone filter. The purified juice is subsequently boiled in an evaporation pot, where it condenses into syrup as it is heated. The syrup is then poured into a centrifuge, where the sugar crystals are separated from the syrup. Finally, the extracted sugar crystals are dried and cooled in a cylindrical container, resulting in the production of edible sugar.
収穫後、サトウキビは機械を使用して粉砕され、液体(juice)が抽出されます。その後、石灰石フィルター(Limestone filter)で精製されます。その後、精製されたジュースは蒸発鍋で煮沸され、加熱されるとシロップに凝縮されます。シロップを遠心分離器に流し込み、シロップから糖の結晶を分離します。最後に、抽出された糖の結晶を乾燥させ、円筒状の容器に入れて冷却し、食用糖を製造する。
グラフ/表コンビネーション その1
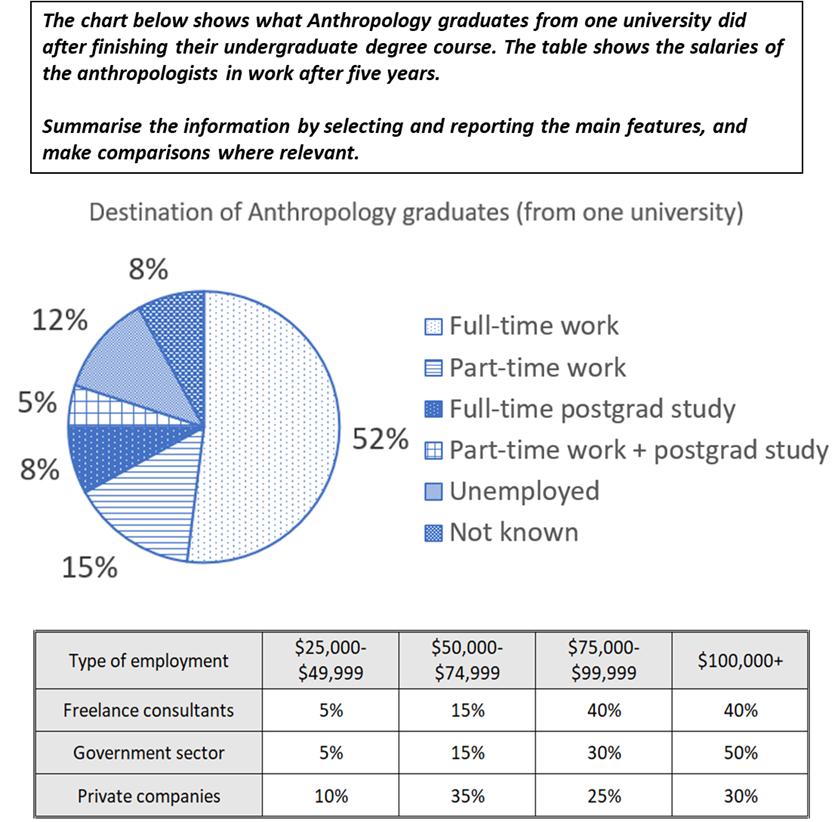
サンプル回答&ポイント解説
サンプル回答
The pie chart illustrates the post-graduation activities of students who completed an anthropology course at a university, while the table details their income five years later, based on the type of employment. Overall, the majority of graduates secured full-time employment, with those working as freelancers or in the government sector earning higher salaries.
円グラフは大学の人類学(Anthropology)コースを修了した学生の卒業後の進路を、表は就職先別に5年後の収入を示している。全体では、卒業生の大半が正社員として就職しており、フリーランスや官公庁で働いている人の方が給与が高い。
Regarding employment types, just over half of the graduates (52%) took up full-time positions, which represented the largest proportion, followed by part-time employment at 15%. A small proportion of students opted to pursue further education, with 8% fully dedicating themselves to postgraduate studies, while 5% combined their studies with part-time work. Meanwhile, 12% of students were unemployed.
雇用形態では、卒業生の半数強 (52%) がフルタイムの仕事に就いている人が最も多く、次いでパートタイムの仕事が15%であった。進学を選択した学生の割合は少なく、8%が大学院での研究に専念し、5%がパートタイムの仕事と学業を両立していた。一方、12%の学生が失業していた。
In terms of salaries, graduates working as freelance consultants or in government roles earned notably higher incomes. A substantial 80% of these individuals earned more than $75,000, with half of those in government positions earning over $100,000. In contrast, only 55% of those employed in the private sector earned at least $75,000. Furthermore, only 5% of individuals in freelance or government positions fell within the lowest salary bracket of $25,000 to $49,999, compared to 10% of those employed in the private sector.
給与に関しては、フリーランスのコンサルタント(Freelance consultants)や政府機関(Government sector)で働いている卒業生の方が収入が顕著に高かった。これらの個人の80%は75,000ドル以上を稼いでおり、政府機関で働いている人の半数は10万ドル以上を稼いでいた。一方、民間会社(Private companies)で雇用されている人のうち、75,000ドル以上を稼いでいる人はわずか55%だった。さらに、25,000ドルから49,999ドルの最低の賃金に該当するのは、フリーランスや政府機関で働いている人の5%に過ぎなかったのに対し、民間会社で雇用されている人では10%であった。
ポイント解説
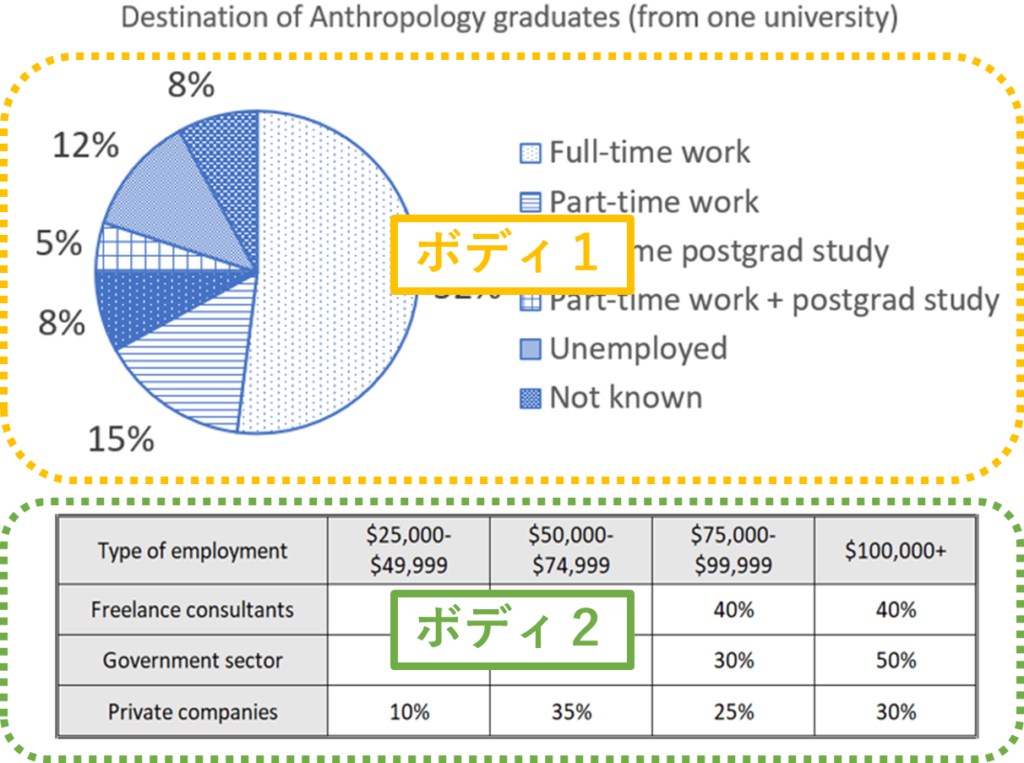
イントロダクション
1文目:問題文のパラフレイズ
- 問題文のパラフレイズについてはこちら
(問題文)The chart below shows what Anthropology graduates from one university did after finishing their undergraduate degree course. The table shows the salaries of the anthropologists in work after five years.
⇓ ⇓ ⇓
(パラフレイズ)The pie chart illustrates the post-graduation activities of students who completed an anthropology course at a university, while the table details their income five years later, based on the type of employment.
円グラフは大学の人類学(Anthropology)コースを修了した学生の卒業後の進路を、表は就職先別に5年後の収入を示している。
2文目:Overall
- Overallについてはこちら
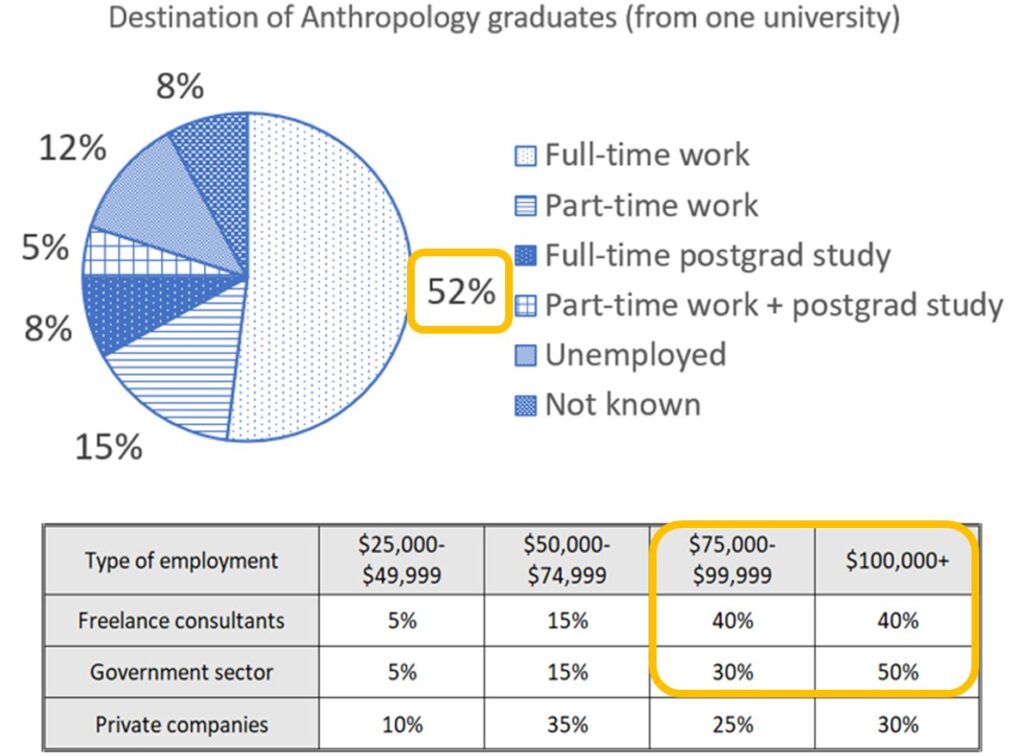
Overall 1文目
全体の傾向としては、円グラフから半数以上(majority)がFull-time workを選択し、表からFreelance consultantsとGovernment sectorで働いた卒業生が比較的高い給与を得ている。
Overall, the majority of graduates secured full-time employment, with those working as freelancers or in the government sector earning higher salaries.
全体では、卒業生の大半が正社員として就職しており、フリーランスや官公庁で働いている人の方が給与が高い。
イントロダクションパラグラフ全体
The pie chart illustrates the post-graduation activities of students who completed an anthropology course at a university, while the table details their income five years later, based on the type of employment. Overall, the majority of graduates secured full-time employment, with those working as freelancers or in the government sector earning higher salaries.
円グラフは大学の人類学(Anthropology)コースを修了した学生の卒業後の進路を、表は就職先別に5年後の収入を示している。全体では、卒業生の大半が正社員として就職しており、フリーランスや官公庁で働いている人の方が給与が高い。
ボディ1
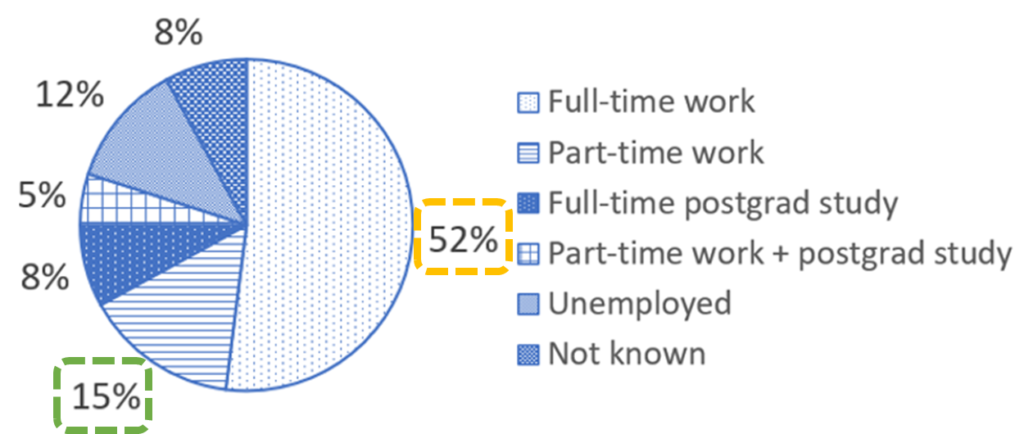
ボディ1 1文目
半分ちょっと(52%)の卒業生はFull-time workを選択した。Full-time workの割合が一番多く、次いでPart-time workの15%だった。
Regarding employment types, just over half of the graduates (52%) took up full-time positions, which represented the largest proportion, followed by part-time employment at 15%.
雇用形態では、卒業生の半数強 (52%) がフルタイムの仕事に就いている人が最も多く、次いでパートタイムの仕事が15%であった。
ポイント
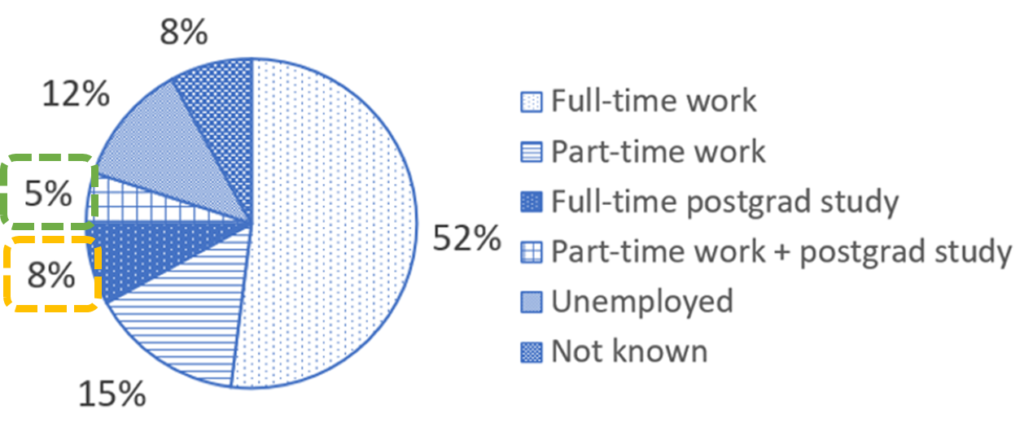
ボディ1 2文目
少数の割合の卒業生がさらに勉強することを選択して、Full-time postgrad studyを選んだ卒業生は8%、Part-time work + postgrad studyを選んだ卒業生は5%だった。
A small proportion of students opted to pursue further education, with 8% fully dedicating themselves to postgraduate studies, while 5% combined their studies with part-time work.
進学を選択した学生の割合は少なく、8%が大学院での研究に専念し、5%がパートタイムの仕事と学業を両立していた。
ポイント
- 付帯状況のwithを使って数値の説明を追加しました。数値の説明の追加はこちら
- whileを使った対比表現を書きました。
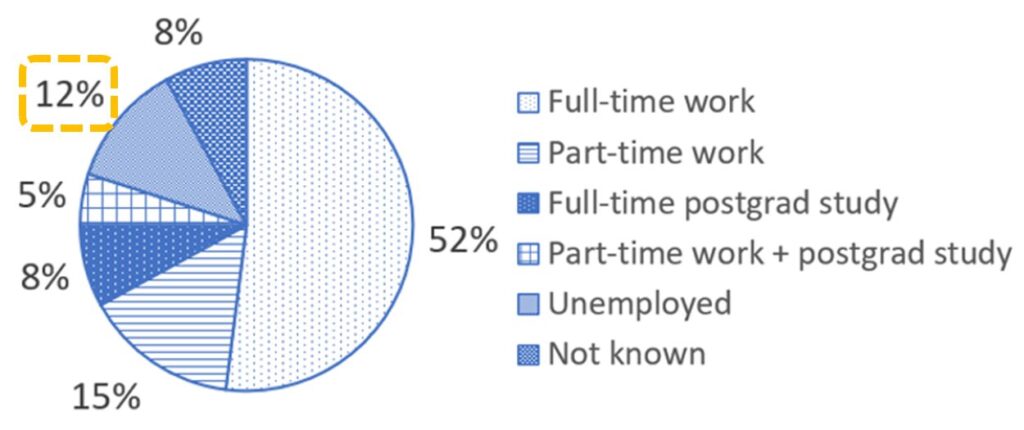
ボディ1 3文目
12%が雇用されなかった。
Meanwhile, 12% of students were unemployed.
一方、12%の学生が失業していた。
ボディ1全体
Regarding employment types, just over half of the graduates (52%) took up full-time positions, which represented the largest proportion, followed by part-time employment at 15%. A small proportion of students opted to pursue further education, with 8% fully dedicating themselves to postgraduate studies, while 5% combined their studies with part-time work. Meanwhile, 12% of students were unemployed.
雇用形態では、卒業生の半数強 (52%) がフルタイムの仕事に就いている人が最も多く、次いでパートタイムの仕事が15%であった。進学を選択した学生の割合は少なく、8%が大学院での研究に専念し、5%がパートタイムの仕事と学業を両立していた。一方、12%の学生が失業していた。
ボディ2
ボディ2 1文目
全体の傾向として、卒業後にFreelance consultantsとGovernment sectorで働いている人の方が収入が高いことが分かります。
In terms of salaries, graduates working as freelance consultants or in government roles earned notably higher incomes.
給与に関しては、フリーランスのコンサルタント(Freelance consultants)や政府機関(Government sector)で働いている卒業生の方が収入が顕著に高かった。
ポイント
- ボディ1はRegardingを使って円ブラフについて書くことを表しましたので、ここではIn terms ofを使って表について書いていること先に書きました。
- salariesをincomesにパラフレイズしました。また、表のGovernment sectorもgovernment rolesにパラフレイズしました。
ボディ2 2文目
Freelance consultantsとGovernment sectorで$75,000-$99,999と$100,000の割合の合計(=$75,000以上の所得がある人の割合)は80%(オレンジ)で、Government sectorは半分(50%)が$100,000以上(赤)だった。一方で、Private companyで働いた卒業生で$75,000以上所得があった人は55%(25%+30%)(緑)だった。
A substantial 80% of these individuals earned more than $75,000, with half of those in government positions earning over $100,000. In contrast, only 55% of those employed in the private sector earned at least $75,000.
これらの個人の80%は75,000ドル以上を稼いでおり、政府機関で働いている人の半数は10万ドル以上を稼いでいた。一方、民間会社(Private companies)で雇用されている人のうち、75,000ドル以上を稼いでいる人はわずか55%だった。
ポイント
- 付帯状況のwithを使って数値の説明を追加しました。数値の説明の追加はこちら
- Government sectorをgovernment positionsにパラフレイズしました。またPrivate companyをprivate sectorにパラフレイズしました。
- Freelance consultants, Government sectorとPrivate companyをIn contrastを使って対比させました。
ボディ2 3文目
Freelance consultantsとGovernment sectorで働いている卒業生は$25,000-$49,999の割合が5%(オレンジ)だったのに対して、Private companyでは10%(緑)だった。
Furthermore, only 5% of individuals in freelance or government positions fell within the lowest salary bracket of $25,000 to $49,999, compared to 10% of those employed in the private sector.
さらに、25,000ドルから49,999ドルの最低の賃金に該当するのは、フリーランスや政府機関で働いている人の5%に過ぎなかったのに対し、民間会社で雇用されている人では10%であった。
ポイント
- Freelance consultants, Government sectorとPrivate companyをcompared toを使って対比させました。2文目でIn contrastを使ったのでここではcompared toにしました。
ボディ2全体
In terms of salaries, graduates working as freelance consultants or in government roles earned notably higher incomes. A substantial 80% of these individuals earned more than $75,000, with half of those in government positions earning over $100,000. In contrast, only 55% of those employed in the private sector earned at least $75,000. Furthermore, only 5% of individuals in freelance or government positions fell within the lowest salary bracket of $25,000 to $49,999, compared to 10% of those employed in the private sector.
給与に関しては、フリーランスのコンサルタント(Freelance consultants)や政府機関(Government sector)で働いている卒業生の方が収入が顕著に高かった。これらの個人の80%は75,000ドル以上を稼いでおり、政府機関で働いている人の半数は10万ドル以上を稼いでいた。一方、民間会社(Private companies)で雇用されている人のうち、75,000ドル以上を稼いでいる人はわずか55%だった。さらに、25,000ドルから49,999ドルの最低の賃金に該当するのは、フリーランスや政府機関で働いている人の5%に過ぎなかったのに対し、民間会社で雇用されている人では10%であった。
グラフ/表コンビネーション その2
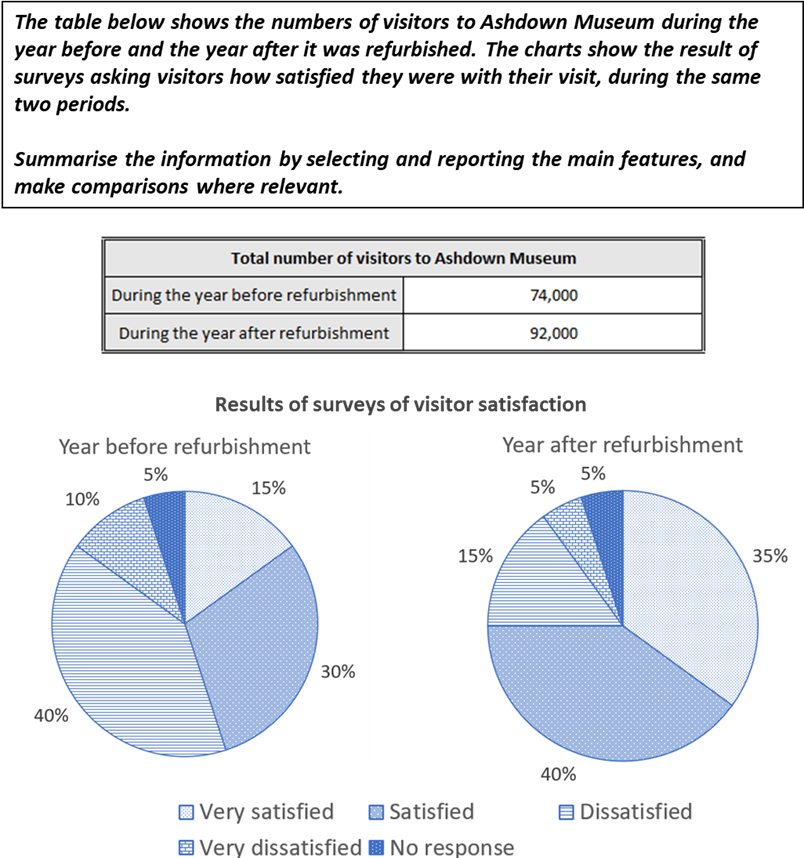
サンプル回答&ポイント解説
サンプル回答
The table and two pie charts compare the number of visitors to Ashdown Museum in the year before and the year after its refurbishment, as well as the levels of visitor satisfaction during these periods. Overall, both visitor numbers and satisfaction increased following the renovation.
表と2つの円グラフは、アシュダウン博物館の改修前の年と改修後の年の来館者数と、これらの期間における来館者の満足度を比較したものである。全体として、来館者数と満足度の両方が改修後に増加した。
According to the table, the annual number of visitors saw a significant rise after the refurbishment, increasing from 74,000 to 92,000.
表によると、年間の来館者数は改修後に大幅に増加し、74,000人から92,000人に増加した。
The pie charts clearly demonstrate that visitors were more satisfied after the renovation. In the year following the refurbishment, three-quarters of respondents reported being either “very satisfied” or “satisfied,” compared to only 45% in the year prior. Notably, just over a third of visitors in the post-renovation period selected the highest rating, “very satisfied,” whereas only 15% had done so before the improvement. Conversely, the proportion of visitors who rated their experience as “dissatisfied” was highest in the year before the refurbishment, at 40%. After the renovation, this figure dropped significantly to just 15%, while the percentage of those who were “very dissatisfied” halved to 5%. The proportion of respondents who did not provide a response remained unchanged at 5%.
円グラフは、改修後に来館者の満足度が向上したことを明確に示している。「非常に満足している(very satisfied)」または「満足している(satisfied)」と回答した人の割合は、改修前の45%から改修後の年には3/4(75%)に増加した。注目すべきは、改修前の15%が最高評価の「非常に満足している(very satisfied)」を選択したのに対し、改修後の来館者では1/3強(=35%)となっていることだ。逆に、「満足していない(dissatisfied)」と回答した人の割合は、改修前の年が40%と最も高かった。改修後は15%と大幅に減少し、「非常に不満(very dissatisfied)」と回答した人の割合は5%と半減した。無回答(No response)の割合は5%で横ばいだった。
ポイント解説
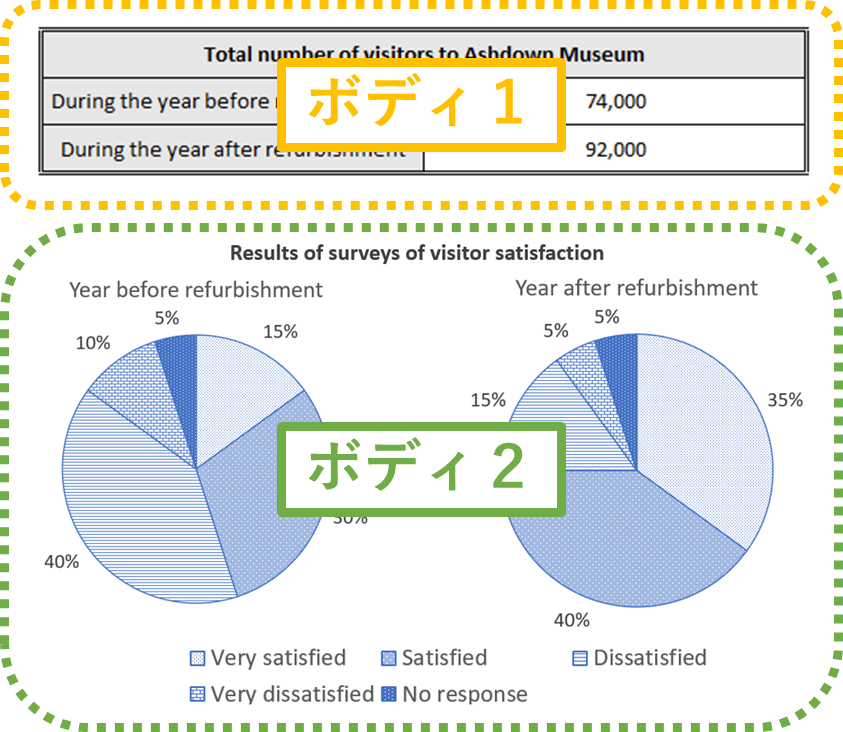
イントロダクション
1文目:問題文のパラフレイズ
- 問題文のパラフレイズについてはこちら
(問題文)The table below shows the numbers of visitors to Ashdown Museum during the year before and the year after it was refurbished. The charts show the result of surveys asking visitors how satisfied they were with their visit, during the same two periods.
⇓ ⇓ ⇓
(パラフレイズ)The table and two pie charts compare the number of visitors to Ashdown Museum in the year before and the year after its refurbishment, as well as the levels of visitor satisfaction during these periods.
表と2つの円グラフは、アシュダウン博物館の改修前の年と改修後の年の来館者数と、これらの期間における来館者の満足度を比較したものである。
2文目:Overall
- Overallについてはこちら
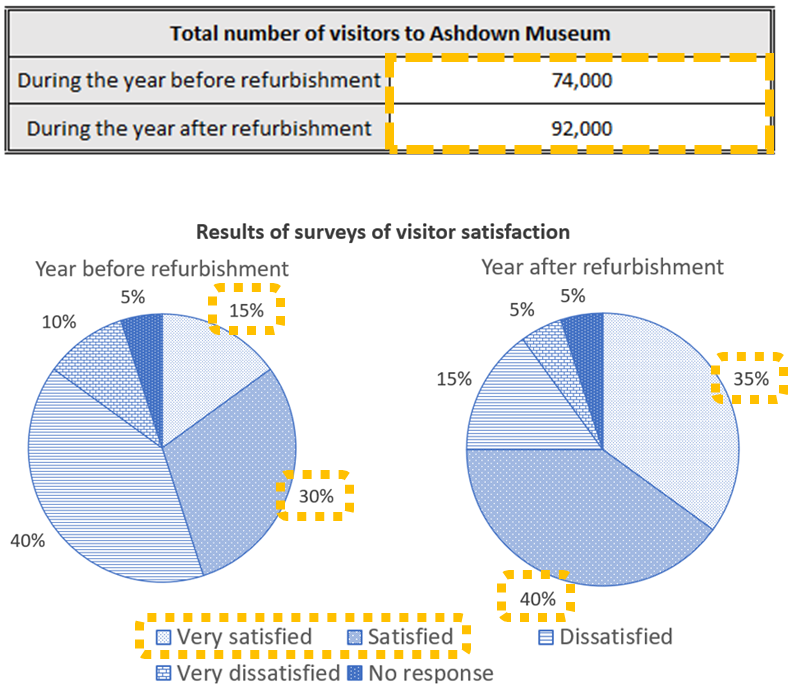
全体の傾向として、改修によって入場者数が増えて、Very satisfiedとSatisfiedと答えた人の割合が増えた。
Overall, both visitor numbers and satisfaction increased following the renovation.
全体として、来館者数と満足度の両方が改修後に増加した。
イントロダクションパラグラフ全体
The table and two pie charts compare the number of visitors to Ashdown Museum in the year before and the year after its refurbishment, as well as the levels of visitor satisfaction during these periods. Overall, both visitor numbers and satisfaction increased following the renovation.
表と2つの円グラフは、アシュダウン博物館の改修前の年と改修後の年の来館者数と、これらの期間における来館者の満足度を比較したものである。全体として、来館者数と満足度の両方が改修後に増加した。
ボディ1
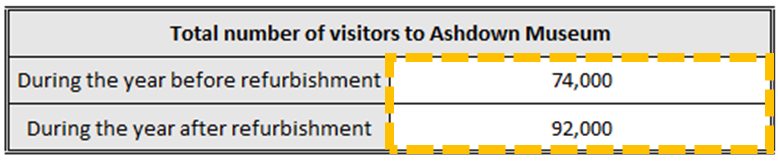
ボディ1 1文目
表を見ると、改修によって美術館の入場者が74,000人から92,000人に増えました。
According to the table, the annual number of visitors saw a significant rise after the refurbishment, increasing from 74,000 to 92,000.
表によると、年間の来館者数は改修後に大幅に増加し、74,000人から92,000人に増加した。
ポイント
- 表と円グラフのどちらについて書いているのか明記するためにAccording toを使って円グラフについて書いていること先に書きました。
- 改修前の年と後の年を表すのにannualを使いました。
- イントロダクションパラグラフでincreasedを使ったのでここではsaw ariseを使いました。上がる/増えるの表現はこちら
ボディ1全体
According to the table, the annual number of visitors saw a significant rise after the refurbishment, increasing from 74,000 to 92,000.
表によると、年間の来館者数は改修後に大幅に増加し、74,000人から92,000人に増加した。
ボディ2
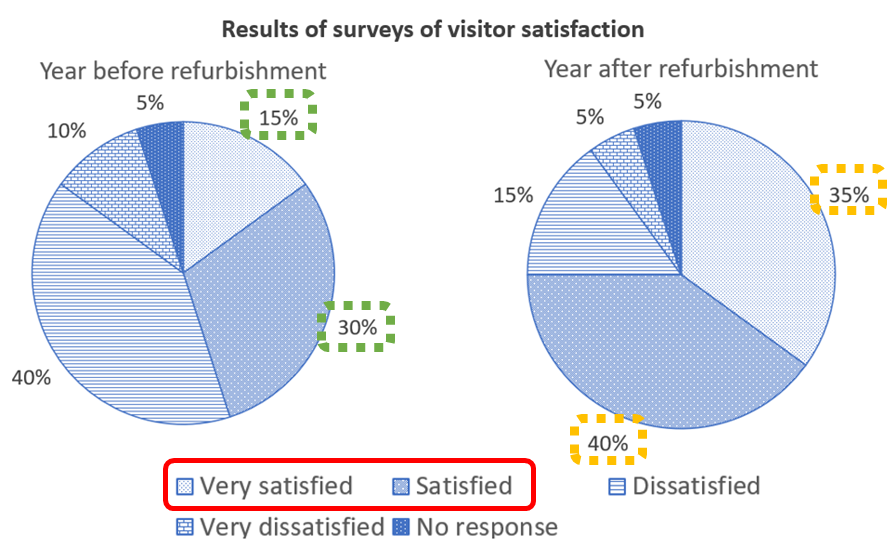
ボディ2 1文目&2文目
円グラフは入場者が回収に満足していること表している。改修後は75%(35%+40%)が”very satisfied”か”satisfied”(オレンジ)と回答しているのに対し、改修前は45%(15%+30%)(緑)だった。
The pie charts clearly demonstrate that visitors were more satisfied after the renovation. In the year following the refurbishment, three-quarters of respondents reported being either “very satisfied” or “satisfied”, compared to only 45% in the year prior.
円グラフは、改修後に来館者の満足度が向上したことを明確に示している。「非常に満足している(very satisfied)」または「満足している(satisfied)」と回答した人の割合は、改修前の45%から改修後の年には3/4(75%)に増加した。
ポイント
- after refurbishmentをfollowing the refurbishmentにパラフレイズしました。
- 75%を3/4(three-quarters)で表しました。何分の1の表現はこちら
- 改修前と後をcompared toを使って対比表現しました。
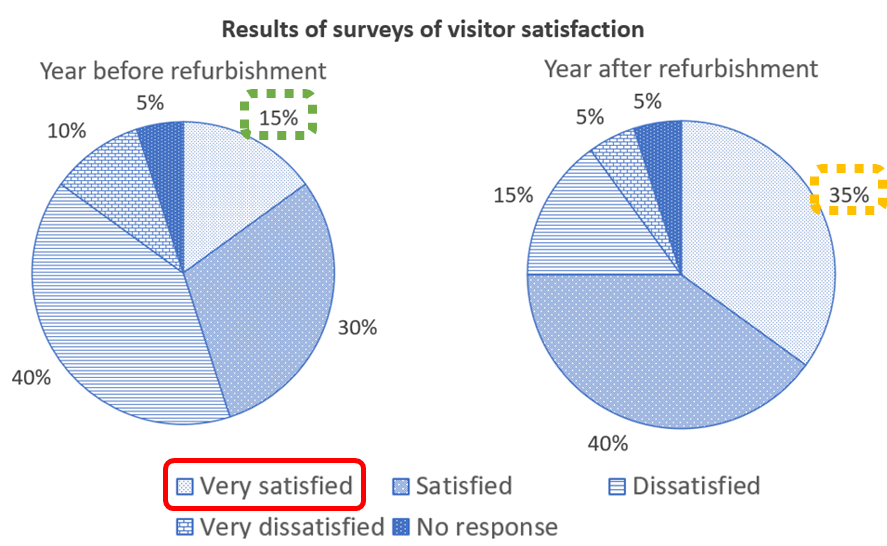
ボディ2 3文目
“very satisfied”と回答したのは改修前35%だったのに対して改修前は15%だった。
Notably, just over a third of visitors in the post-renovation period selected the highest rating, “very satisfied”, whereas only 15% had done so before the improvement.
注目すべきは、改修前の15%が最高評価の「非常に満足している(very satisfied)」を選択したのに対し、改修後の来館者では1/3強(=35%)となっていることだ。
ポイント
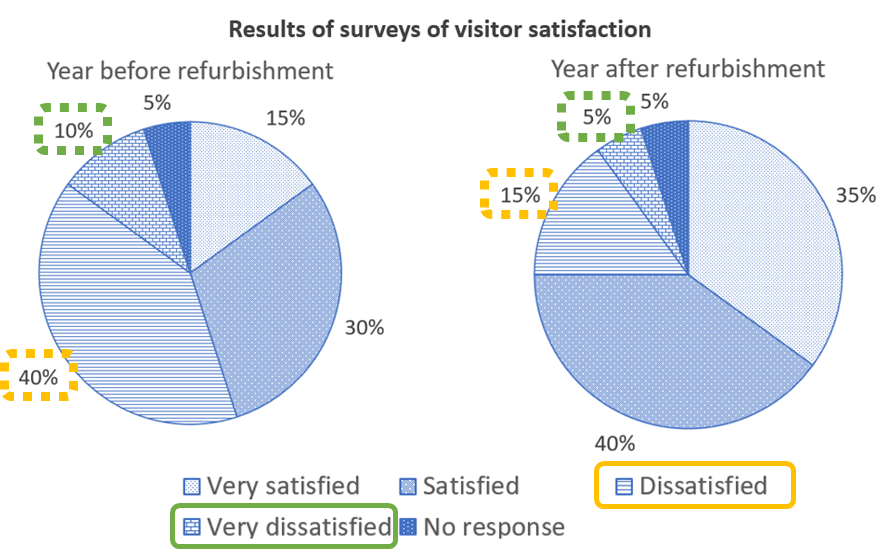
ボディ2 4文目
(満足の回答とは)対照的に、改修前は“dissatisfied”と回答した人が最も多く40%だったのが改修後はこれが15%(オレンジ)になった。“very dissatisfied”と答えた人は10%から5%に半減(緑)した。
Conversely, the proportion of visitors who rated their experience as “dissatisfied” was highest in the year before the refurbishment, at 40%. After the renovation, this figure dropped significantly to just 15%, while the percentage of those who were “very dissatisfied” halved to 5%.
逆に、「満足していない(dissatisfied)」と回答した人の割合は、改修前の年が40%と最も高かった。改修後は15%と大幅に減少し、「非常に不満(very dissatisfied)」と回答した人の割合は5%と半減した。
ポイント
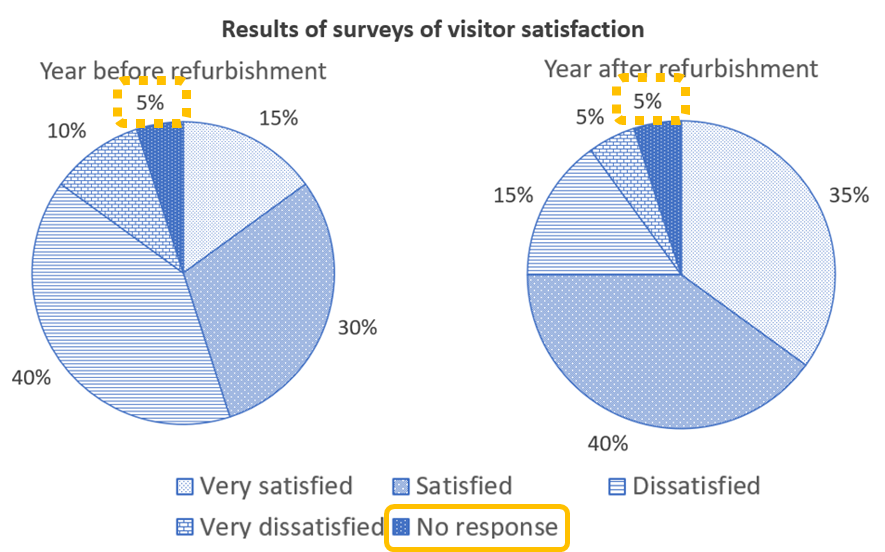
ボディ2全体
The pie charts clearly demonstrate that visitors were more satisfied after the renovation. In the year following the refurbishment, three-quarters of respondents reported being either “very satisfied” or “satisfied,” compared to only 45% in the year prior. Notably, just over a third of visitors in the post-renovation period selected the highest rating, “very satisfied”, whereas only 15% had done so before the improvement. Conversely, the proportion of visitors who rated their experience as “dissatisfied” was highest in the year before the refurbishment, at 40%. After the renovation, this figure dropped significantly to just 15%, while the percentage of those who were “very dissatisfied” halved to 5%. The proportion of respondents who did not provide a response remained unchanged at 5%.
円グラフは、改修後に来館者の満足度が向上したことを明確に示している。「非常に満足している(very satisfied)」または「満足している(satisfied)」と回答した人の割合は、改修前の45%から改修後の年には3/4(75%)に増加した。注目すべきは、改修前の15%が最高評価の「非常に満足している(very satisfied)」を選択したのに対し、改修後の来館者では1/3強(=35%)となっていることだ。逆に、「満足していない(dissatisfied)」と回答した人の割合は、改修前の年が40%と最も高かった。改修後は15%と大幅に減少し、「非常に不満(very dissatisfied)」と回答した人の割合は5%と半減した。無回答(No response)の割合は5%で横ばいだった。
関連記事


この記事/ウェブページは、日本人学習者として純ジャパ・留学経験なしで
IELTS Overall 8.0 を達成し、日本人向けにIELTS指導・アドバイスを行っている
Toshikazu Tsuboiが執筆しています。
(最高スコア:L9.0 / R8.5 / W7.5 / S8.5)
Written by Toshikazu Tsuboi,
an IELTS instructor who achieved Overall Band 8.0 without studying abroad,
specializing in Japanese learners.
(Max scores: L9.0 / R8.5 / W7.5 / S8.5)